
 Yahoo Finance
 Revolution Bars Group (LON:RBG) Will Be Hoping To Turn Its Returns On Capital Around
What are the early trends we should look for to identify a stock that could multiply in value over the long term? One common approach is to try and find a company with returns on capital employed (ROCE) that are increasing, in conjunction with a growing amount of capital employed. Ultimately, this demonstrates that it's a business that is reinvesting profits at increasing rates of return. In light of that, when we looked at Revolution Bars Group (LON:RBG) and its ROCE trend, we weren't exactly thrilled.
Return On Capital Employed (ROCE): What Is It?
For those who don't know, ROCE is a measure of a company's yearly pre-tax profit (its return), relative to the capital employed in the business. The formula for this calculation on Revolution Bars Group is:
Return on Capital Employed = Earnings Before Interest and Tax (EBIT) ÷ (Total Assets - Current Liabilities)
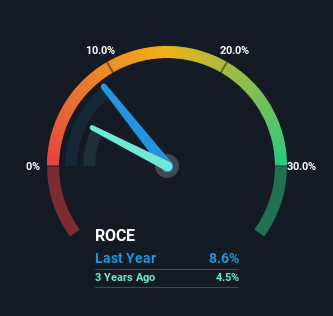
0.086 = UK£8.0m ÷ (UK£130m - UK£37m) (Based on the trailing twelve months to July 2022).
Therefore, Revolution Bars Group has an ROCE of 8.6%. In absolute terms, that's a low return, but it's much better than the Hospitality industry average of 6.3%.
View our latest analysis for Revolution Bars Group
Above you can see how the current ROCE for Revolution Bars Group compares to its prior returns on capital, but there's only so much you can tell from the past. If you're interested, you can view the analysts predictions in our free report on analyst forecasts for the company.
What Does the ROCE Trend For Revolution Bars Group Tell Us?
When we looked at the ROCE trend at Revolution Bars Group, we didn't gain much confidence. Over the last five years, returns on capital have decreased to 8.6% from 16% five years ago. However, given capital employed and revenue have both increased it appears that the business is currently pursuing growth, at the consequence of short term returns. If these investments prove successful, this can bode very well for long term stock performance.
The Key Takeaway
In summary, despite lower returns in the short term, we're encouraged to see that Revolution Bars Group is reinvesting for growth and has higher sales as a result. But since the stock has dived 97% in the last five years, there could be other drivers that are influencing the business' outlook. Therefore, we'd suggest researching the stock further to uncover more about the business.
One more thing: We've identified 6 warning signs with Revolution Bars Group (at least 3 which don't sit too well with us) , and understanding these would certainly be useful.
If you want to search for solid companies with great earnings, check out this free list of companies with good balance sheets and impressive returns on equity.
Have feedback on this article? Concerned about the content? Get in touch with us directly. Alternatively, email editorial-team (at) simplywallst.com.
This article by Simply Wall St is general in nature. We provide commentary based on historical data and analyst forecasts only using an unbiased methodology and our articles are not intended to be financial advice. It does not constitute a recommendation to buy or sell any stock, and does not take account of your objectives, or your financial situation. We aim to bring you long-term focused analysis driven by fundamental data. Note that our analysis may not factor in the latest price-sensitive company announcements or qualitative material. Simply Wall St has no position in any stocks mentioned.
Join A Paid User Research Session
You’ll receive a US$30 Amazon Gift card for 1 hour of your time while helping us build better investing tools for the individual investors like yourself. Sign up here
