
 Yahoo Finance
 Revenues Not Telling The Story For HomeToGo SE (ETR:HTG)
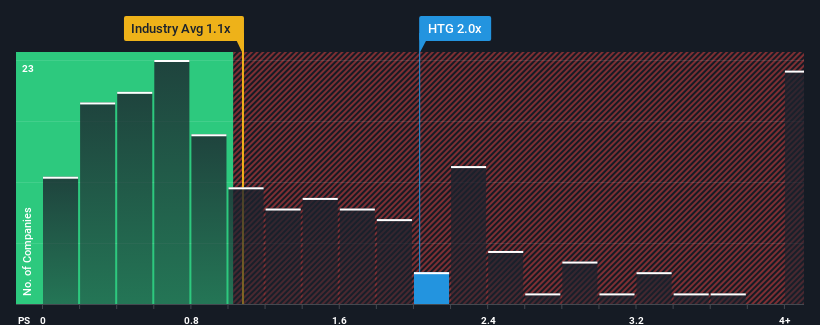
When you see that almost half of the companies in the Hospitality industry in Germany have price-to-sales ratios (or "P/S") below 0.8x, HomeToGo SE (ETR:HTG) looks to be giving off some sell signals with its 2x P/S ratio. Although, it's not wise to just take the P/S at face value as there may be an explanation why it's as high as it is.
See our latest analysis for HomeToGo
What Does HomeToGo's P/S Mean For Shareholders?
HomeToGo could be doing better as it's been growing revenue less than most other companies lately. It might be that many expect the uninspiring revenue performance to recover significantly, which has kept the P/S ratio from collapsing. If not, then existing shareholders may be very nervous about the viability of the share price.
Want the full picture on analyst estimates for the company? Then our free report on HomeToGo will help you uncover what's on the horizon.
Do Revenue Forecasts Match The High P/S Ratio?
HomeToGo's P/S ratio would be typical for a company that's expected to deliver solid growth, and importantly, perform better than the industry.
Retrospectively, the last year delivered a decent 8.0% gain to the company's revenues. This was backed up an excellent period prior to see revenue up by 142% in total over the last three years. So we can start by confirming that the company has done a great job of growing revenues over that time.
Looking ahead now, revenue is anticipated to climb by 16% per annum during the coming three years according to the six analysts following the company. That's shaping up to be materially lower than the 325% per year growth forecast for the broader industry.
With this information, we find it concerning that HomeToGo is trading at a P/S higher than the industry. Apparently many investors in the company are way more bullish than analysts indicate and aren't willing to let go of their stock at any price. Only the boldest would assume these prices are sustainable as this level of revenue growth is likely to weigh heavily on the share price eventually.
The Final Word
Using the price-to-sales ratio alone to determine if you should sell your stock isn't sensible, however it can be a practical guide to the company's future prospects.
It comes as a surprise to see HomeToGo trade at such a high P/S given the revenue forecasts look less than stellar. The weakness in the company's revenue estimate doesn't bode well for the elevated P/S, which could take a fall if the revenue sentiment doesn't improve. At these price levels, investors should remain cautious, particularly if things don't improve.
Don't forget that there may be other risks. For instance, we've identified 2 warning signs for HomeToGo that you should be aware of.
If companies with solid past earnings growth is up your alley, you may wish to see this free collection of other companies with strong earnings growth and low P/E ratios.
Have feedback on this article? Concerned about the content? Get in touch with us directly. Alternatively, email editorial-team (at) simplywallst.com.
This article by Simply Wall St is general in nature. We provide commentary based on historical data and analyst forecasts only using an unbiased methodology and our articles are not intended to be financial advice. It does not constitute a recommendation to buy or sell any stock, and does not take account of your objectives, or your financial situation. We aim to bring you long-term focused analysis driven by fundamental data. Note that our analysis may not factor in the latest price-sensitive company announcements or qualitative material. Simply Wall St has no position in any stocks mentioned.
