
 Yahoo Finance
 Returns At Teck Resources (TSE:TECK.B) Appear To Be Weighed Down
There are a few key trends to look for if we want to identify the next multi-bagger. In a perfect world, we'd like to see a company investing more capital into its business and ideally the returns earned from that capital are also increasing. Basically this means that a company has profitable initiatives that it can continue to reinvest in, which is a trait of a compounding machine. With that in mind, the ROCE of Teck Resources (TSE:TECK.B) looks decent, right now, so lets see what the trend of returns can tell us.
What Is Return On Capital Employed (ROCE)?
For those that aren't sure what ROCE is, it measures the amount of pre-tax profits a company can generate from the capital employed in its business. To calculate this metric for Teck Resources, this is the formula:
Return on Capital Employed = Earnings Before Interest and Tax (EBIT) ÷ (Total Assets - Current Liabilities)
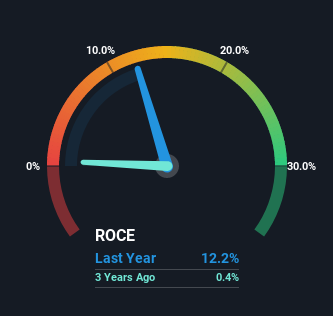
0.12 = CA$5.9b ÷ (CA$54b - CA$5.8b) (Based on the trailing twelve months to March 2023).
Therefore, Teck Resources has an ROCE of 12%. In absolute terms, that's a satisfactory return, but compared to the Metals and Mining industry average of 3.8% it's much better.
View our latest analysis for Teck Resources
In the above chart we have measured Teck Resources' prior ROCE against its prior performance, but the future is arguably more important. If you're interested, you can view the analysts predictions in our free report on analyst forecasts for the company.
How Are Returns Trending?
While the returns on capital are good, they haven't moved much. The company has consistently earned 12% for the last five years, and the capital employed within the business has risen 35% in that time. 12% is a pretty standard return, and it provides some comfort knowing that Teck Resources has consistently earned this amount. Over long periods of time, returns like these might not be too exciting, but with consistency they can pay off in terms of share price returns.
In Conclusion...
The main thing to remember is that Teck Resources has proven its ability to continually reinvest at respectable rates of return. And since the stock has risen strongly over the last five years, it appears the market might expect this trend to continue. So while investors seem to be recognizing these promising trends, we still believe the stock deserves further research.
On a final note, we found 2 warning signs for Teck Resources (1 makes us a bit uncomfortable) you should be aware of.
If you want to search for solid companies with great earnings, check out this free list of companies with good balance sheets and impressive returns on equity.
Have feedback on this article? Concerned about the content? Get in touch with us directly. Alternatively, email editorial-team (at) simplywallst.com.
This article by Simply Wall St is general in nature. We provide commentary based on historical data and analyst forecasts only using an unbiased methodology and our articles are not intended to be financial advice. It does not constitute a recommendation to buy or sell any stock, and does not take account of your objectives, or your financial situation. We aim to bring you long-term focused analysis driven by fundamental data. Note that our analysis may not factor in the latest price-sensitive company announcements or qualitative material. Simply Wall St has no position in any stocks mentioned.
Join A Paid User Research Session
You’ll receive a US$30 Amazon Gift card for 1 hour of your time while helping us build better investing tools for the individual investors like yourself. Sign up here
