
 Yahoo Finance
 Returns At Polaris (NYSE:PII) Appear To Be Weighed Down
If we want to find a stock that could multiply over the long term, what are the underlying trends we should look for? Typically, we'll want to notice a trend of growing return on capital employed (ROCE) and alongside that, an expanding base of capital employed. Basically this means that a company has profitable initiatives that it can continue to reinvest in, which is a trait of a compounding machine. In light of that, when we looked at Polaris (NYSE:PII) and its ROCE trend, we weren't exactly thrilled.
Understanding Return On Capital Employed (ROCE)
For those who don't know, ROCE is a measure of a company's yearly pre-tax profit (its return), relative to the capital employed in the business. Analysts use this formula to calculate it for Polaris:
Return on Capital Employed = Earnings Before Interest and Tax (EBIT) ÷ (Total Assets - Current Liabilities)
0.16 = US$579m ÷ (US$5.6b - US$1.9b) (Based on the trailing twelve months to March 2024).
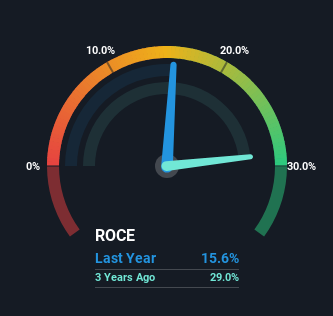
Thus, Polaris has an ROCE of 16%. In absolute terms, that's a pretty normal return, and it's somewhat close to the Leisure industry average of 13%.
View our latest analysis for Polaris
In the above chart we have measured Polaris' prior ROCE against its prior performance, but the future is arguably more important. If you'd like, you can check out the forecasts from the analysts covering Polaris for free.
So How Is Polaris' ROCE Trending?
There hasn't been much to report for Polaris' returns and its level of capital employed because both metrics have been steady for the past five years. It's not uncommon to see this when looking at a mature and stable business that isn't re-investing its earnings because it has likely passed that phase of the business cycle. So unless we see a substantial change at Polaris in terms of ROCE and additional investments being made, we wouldn't hold our breath on it being a multi-bagger.
The Bottom Line On Polaris' ROCE
We can conclude that in regards to Polaris' returns on capital employed and the trends, there isn't much change to report on. Unsurprisingly, the stock has only gained 9.5% over the last five years, which potentially indicates that investors are accounting for this going forward. So if you're looking for a multi-bagger, the underlying trends indicate you may have better chances elsewhere.
On a separate note, we've found 2 warning signs for Polaris you'll probably want to know about.
If you want to search for solid companies with great earnings, check out this free list of companies with good balance sheets and impressive returns on equity.
Have feedback on this article? Concerned about the content? Get in touch with us directly. Alternatively, email editorial-team (at) simplywallst.com.
This article by Simply Wall St is general in nature. We provide commentary based on historical data and analyst forecasts only using an unbiased methodology and our articles are not intended to be financial advice. It does not constitute a recommendation to buy or sell any stock, and does not take account of your objectives, or your financial situation. We aim to bring you long-term focused analysis driven by fundamental data. Note that our analysis may not factor in the latest price-sensitive company announcements or qualitative material. Simply Wall St has no position in any stocks mentioned.
