
 Yahoo Finance
 The Returns At Inter-Rock Minerals (CVE:IRO) Aren't Growing
If you're looking for a multi-bagger, there's a few things to keep an eye out for. Amongst other things, we'll want to see two things; firstly, a growing return on capital employed (ROCE) and secondly, an expansion in the company's amount of capital employed. This shows us that it's a compounding machine, able to continually reinvest its earnings back into the business and generate higher returns. However, after briefly looking over the numbers, we don't think Inter-Rock Minerals (CVE:IRO) has the makings of a multi-bagger going forward, but let's have a look at why that may be.
Understanding Return On Capital Employed (ROCE)
If you haven't worked with ROCE before, it measures the 'return' (pre-tax profit) a company generates from capital employed in its business. Analysts use this formula to calculate it for Inter-Rock Minerals:
Return on Capital Employed = Earnings Before Interest and Tax (EBIT) ÷ (Total Assets - Current Liabilities)
0.17 = US$2.6m ÷ (US$22m - US$7.1m) (Based on the trailing twelve months to September 2023).
Therefore, Inter-Rock Minerals has an ROCE of 17%. On its own, that's a standard return, however it's much better than the 7.6% generated by the Food industry.
View our latest analysis for Inter-Rock Minerals
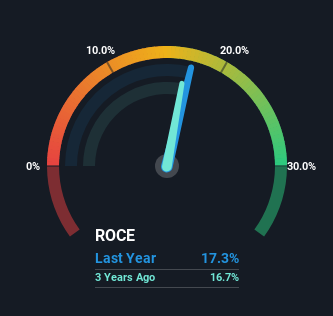
Historical performance is a great place to start when researching a stock so above you can see the gauge for Inter-Rock Minerals' ROCE against it's prior returns. If you want to delve into the historical earnings, revenue and cash flow of Inter-Rock Minerals, check out these free graphs here.
How Are Returns Trending?
There hasn't been much to report for Inter-Rock Minerals' returns and its level of capital employed because both metrics have been steady for the past five years. Businesses with these traits tend to be mature and steady operations because they're past the growth phase. So don't be surprised if Inter-Rock Minerals doesn't end up being a multi-bagger in a few years time.
What We Can Learn From Inter-Rock Minerals' ROCE
In a nutshell, Inter-Rock Minerals has been trudging along with the same returns from the same amount of capital over the last five years. Investors must think there's better things to come because the stock has knocked it out of the park, delivering a 150% gain to shareholders who have held over the last five years. Ultimately, if the underlying trends persist, we wouldn't hold our breath on it being a multi-bagger going forward.
Since virtually every company faces some risks, it's worth knowing what they are, and we've spotted 3 warning signs for Inter-Rock Minerals (of which 2 are a bit concerning!) that you should know about.
While Inter-Rock Minerals isn't earning the highest return, check out this free list of companies that are earning high returns on equity with solid balance sheets.
Have feedback on this article? Concerned about the content? Get in touch with us directly. Alternatively, email editorial-team (at) simplywallst.com.
This article by Simply Wall St is general in nature. We provide commentary based on historical data and analyst forecasts only using an unbiased methodology and our articles are not intended to be financial advice. It does not constitute a recommendation to buy or sell any stock, and does not take account of your objectives, or your financial situation. We aim to bring you long-term focused analysis driven by fundamental data. Note that our analysis may not factor in the latest price-sensitive company announcements or qualitative material. Simply Wall St has no position in any stocks mentioned.
