
 Yahoo Finance
 Returns At Goodfood Market (TSE:FOOD) Are On The Way Up
If we want to find a potential multi-bagger, often there are underlying trends that can provide clues. Typically, we'll want to notice a trend of growing return on capital employed (ROCE) and alongside that, an expanding base of capital employed. Basically this means that a company has profitable initiatives that it can continue to reinvest in, which is a trait of a compounding machine. So on that note, Goodfood Market (TSE:FOOD) looks quite promising in regards to its trends of return on capital.
Return On Capital Employed (ROCE): What Is It?
If you haven't worked with ROCE before, it measures the 'return' (pre-tax profit) a company generates from capital employed in its business. To calculate this metric for Goodfood Market, this is the formula:
Return on Capital Employed = Earnings Before Interest and Tax (EBIT) ÷ (Total Assets - Current Liabilities)
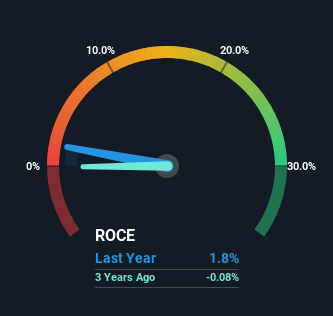
0.018 = CA$513k ÷ (CA$55m - CA$26m) (Based on the trailing twelve months to March 2024).
Therefore, Goodfood Market has an ROCE of 1.8%. In absolute terms, that's a low return and it also under-performs the Consumer Retailing industry average of 12%.
See our latest analysis for Goodfood Market
In the above chart we have measured Goodfood Market's prior ROCE against its prior performance, but the future is arguably more important. If you're interested, you can view the analysts predictions in our free analyst report for Goodfood Market .
What Can We Tell From Goodfood Market's ROCE Trend?
We're delighted to see that Goodfood Market is reaping rewards from its investments and has now broken into profitability. While the business is profitable now, it used to be incurring losses on invested capital five years ago. At first glance, it seems the business is getting more proficient at generating returns, because over the same period, the amount of capital employed has reduced by 35%. This could potentially mean that the company is selling some of its assets.
On a separate but related note, it's important to know that Goodfood Market has a current liabilities to total assets ratio of 48%, which we'd consider pretty high. This effectively means that suppliers (or short-term creditors) are funding a large portion of the business, so just be aware that this can introduce some elements of risk. While it's not necessarily a bad thing, it can be beneficial if this ratio is lower.
The Bottom Line
In summary, it's great to see that Goodfood Market has been able to turn things around and earn higher returns on lower amounts of capital. Although the company may be facing some issues elsewhere since the stock has plunged 89% in the last five years. Still, it's worth doing some further research to see if the trends will continue into the future.
If you'd like to know more about Goodfood Market, we've spotted 3 warning signs, and 1 of them shouldn't be ignored.
For those who like to invest in solid companies, check out this free list of companies with solid balance sheets and high returns on equity.
Have feedback on this article? Concerned about the content? Get in touch with us directly. Alternatively, email editorial-team (at) simplywallst.com.
This article by Simply Wall St is general in nature. We provide commentary based on historical data and analyst forecasts only using an unbiased methodology and our articles are not intended to be financial advice. It does not constitute a recommendation to buy or sell any stock, and does not take account of your objectives, or your financial situation. We aim to bring you long-term focused analysis driven by fundamental data. Note that our analysis may not factor in the latest price-sensitive company announcements or qualitative material. Simply Wall St has no position in any stocks mentioned.
