
 Yahoo Finance
 Returns Are Gaining Momentum At Weyco Group (NASDAQ:WEYS)
If we want to find a stock that could multiply over the long term, what are the underlying trends we should look for? One common approach is to try and find a company with returns on capital employed (ROCE) that are increasing, in conjunction with a growing amount of capital employed. Ultimately, this demonstrates that it's a business that is reinvesting profits at increasing rates of return. So on that note, Weyco Group (NASDAQ:WEYS) looks quite promising in regards to its trends of return on capital.
Understanding Return On Capital Employed (ROCE)
Just to clarify if you're unsure, ROCE is a metric for evaluating how much pre-tax income (in percentage terms) a company earns on the capital invested in its business. Analysts use this formula to calculate it for Weyco Group:
Return on Capital Employed = Earnings Before Interest and Tax (EBIT) ÷ (Total Assets - Current Liabilities)
0.15 = US$41m ÷ (US$309m - US$30m) (Based on the trailing twelve months to December 2023).
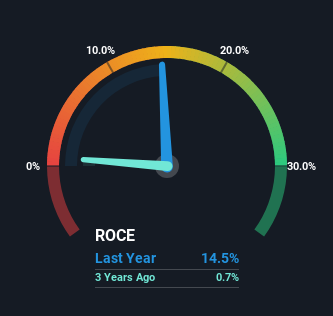
Thus, Weyco Group has an ROCE of 15%. In absolute terms, that's a pretty normal return, and it's somewhat close to the Retail Distributors industry average of 18%.
View our latest analysis for Weyco Group
While the past is not representative of the future, it can be helpful to know how a company has performed historically, which is why we have this chart above. If you'd like to look at how Weyco Group has performed in the past in other metrics, you can view this free graph of Weyco Group's past earnings, revenue and cash flow.
What Does the ROCE Trend For Weyco Group Tell Us?
Weyco Group is showing promise given that its ROCE is trending up and to the right. Looking at the data, we can see that even though capital employed in the business has remained relatively flat, the ROCE generated has risen by 33% over the last five years. So it's likely that the business is now reaping the full benefits of its past investments, since the capital employed hasn't changed considerably. It's worth looking deeper into this though because while it's great that the business is more efficient, it might also mean that going forward the areas to invest internally for the organic growth are lacking.
What We Can Learn From Weyco Group's ROCE
In summary, we're delighted to see that Weyco Group has been able to increase efficiencies and earn higher rates of return on the same amount of capital. Since the stock has only returned 3.6% to shareholders over the last five years, the promising fundamentals may not be recognized yet by investors. So with that in mind, we think the stock deserves further research.
Like most companies, Weyco Group does come with some risks, and we've found 1 warning sign that you should be aware of.
While Weyco Group may not currently earn the highest returns, we've compiled a list of companies that currently earn more than 25% return on equity. Check out this free list here.
Have feedback on this article? Concerned about the content? Get in touch with us directly. Alternatively, email editorial-team (at) simplywallst.com.
This article by Simply Wall St is general in nature. We provide commentary based on historical data and analyst forecasts only using an unbiased methodology and our articles are not intended to be financial advice. It does not constitute a recommendation to buy or sell any stock, and does not take account of your objectives, or your financial situation. We aim to bring you long-term focused analysis driven by fundamental data. Note that our analysis may not factor in the latest price-sensitive company announcements or qualitative material. Simply Wall St has no position in any stocks mentioned.
