
 Yahoo Finance
 Returns Are Gaining Momentum At TFI International (TSE:TFII)
If we want to find a potential multi-bagger, often there are underlying trends that can provide clues. Ideally, a business will show two trends; firstly a growing return on capital employed (ROCE) and secondly, an increasing amount of capital employed. This shows us that it's a compounding machine, able to continually reinvest its earnings back into the business and generate higher returns. So on that note, TFI International (TSE:TFII) looks quite promising in regards to its trends of return on capital.
Understanding Return On Capital Employed (ROCE)
For those who don't know, ROCE is a measure of a company's yearly pre-tax profit (its return), relative to the capital employed in the business. To calculate this metric for TFI International, this is the formula:
Return on Capital Employed = Earnings Before Interest and Tax (EBIT) ÷ (Total Assets - Current Liabilities)
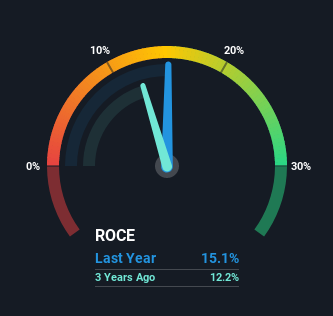
0.15 = US$658m ÷ (US$5.8b - US$1.4b) (Based on the trailing twelve months to December 2021).
Therefore, TFI International has an ROCE of 15%. In absolute terms, that's a satisfactory return, but compared to the Transportation industry average of 6.2% it's much better.
View our latest analysis for TFI International
In the above chart we have measured TFI International's prior ROCE against its prior performance, but the future is arguably more important. If you're interested, you can view the analysts predictions in our free report on analyst forecasts for the company.
So How Is TFI International's ROCE Trending?
The trends we've noticed at TFI International are quite reassuring. Over the last five years, returns on capital employed have risen substantially to 15%. The company is effectively making more money per dollar of capital used, and it's worth noting that the amount of capital has increased too, by 69%. The increasing returns on a growing amount of capital is common amongst multi-baggers and that's why we're impressed.
For the record though, there was a noticeable increase in the company's current liabilities over the period, so we would attribute some of the ROCE growth to that. Effectively this means that suppliers or short-term creditors are now funding 24% of the business, which is more than it was five years ago. Keep an eye out for future increases because when the ratio of current liabilities to total assets gets particularly high, this can introduce some new risks for the business.
The Bottom Line
In summary, it's great to see that TFI International can compound returns by consistently reinvesting capital at increasing rates of return, because these are some of the key ingredients of those highly sought after multi-baggers. And with the stock having performed exceptionally well over the last five years, these patterns are being accounted for by investors. In light of that, we think it's worth looking further into this stock because if TFI International can keep these trends up, it could have a bright future ahead.
If you'd like to know about the risks facing TFI International, we've discovered 2 warning signs that you should be aware of.
If you want to search for solid companies with great earnings, check out this free list of companies with good balance sheets and impressive returns on equity.
Have feedback on this article? Concerned about the content? Get in touch with us directly. Alternatively, email editorial-team (at) simplywallst.com.
This article by Simply Wall St is general in nature. We provide commentary based on historical data and analyst forecasts only using an unbiased methodology and our articles are not intended to be financial advice. It does not constitute a recommendation to buy or sell any stock, and does not take account of your objectives, or your financial situation. We aim to bring you long-term focused analysis driven by fundamental data. Note that our analysis may not factor in the latest price-sensitive company announcements or qualitative material. Simply Wall St has no position in any stocks mentioned.
