
 Yahoo Finance
 Returns Are Gaining Momentum At Sterling Check (NASDAQ:STER)
To find a multi-bagger stock, what are the underlying trends we should look for in a business? In a perfect world, we'd like to see a company investing more capital into its business and ideally the returns earned from that capital are also increasing. Put simply, these types of businesses are compounding machines, meaning they are continually reinvesting their earnings at ever-higher rates of return. So when we looked at Sterling Check (NASDAQ:STER) and its trend of ROCE, we really liked what we saw.
Return On Capital Employed (ROCE): What Is It?
For those that aren't sure what ROCE is, it measures the amount of pre-tax profits a company can generate from the capital employed in its business. The formula for this calculation on Sterling Check is:
Return on Capital Employed = Earnings Before Interest and Tax (EBIT) ÷ (Total Assets - Current Liabilities)
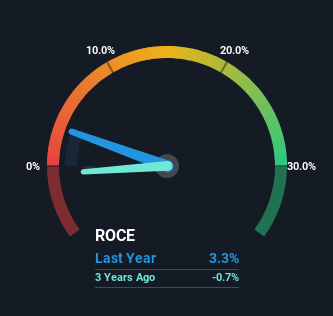
0.033 = US$42m ÷ (US$1.5b - US$167m) (Based on the trailing twelve months to March 2024).
So, Sterling Check has an ROCE of 3.3%. In absolute terms, that's a low return and it also under-performs the Professional Services industry average of 14%.
See our latest analysis for Sterling Check
In the above chart we have measured Sterling Check's prior ROCE against its prior performance, but the future is arguably more important. If you'd like to see what analysts are forecasting going forward, you should check out our free analyst report for Sterling Check .
The Trend Of ROCE
Sterling Check has broken into the black (profitability) and we're sure it's a sight for sore eyes. The company now earns 3.3% on its capital, because four years ago it was incurring losses. While returns have increased, the amount of capital employed by Sterling Check has remained flat over the period. With no noticeable increase in capital employed, it's worth knowing what the company plans on doing going forward in regards to reinvesting and growing the business. Because in the end, a business can only get so efficient.
The Bottom Line
To sum it up, Sterling Check is collecting higher returns from the same amount of capital, and that's impressive. And with a respectable 17% awarded to those who held the stock over the last year, you could argue that these developments are starting to get the attention they deserve. In light of that, we think it's worth looking further into this stock because if Sterling Check can keep these trends up, it could have a bright future ahead.
Before jumping to any conclusions though, we need to know what value we're getting for the current share price. That's where you can check out our FREE intrinsic value estimation for STER that compares the share price and estimated value.
If you want to search for solid companies with great earnings, check out this free list of companies with good balance sheets and impressive returns on equity.
Have feedback on this article? Concerned about the content? Get in touch with us directly. Alternatively, email editorial-team (at) simplywallst.com.
This article by Simply Wall St is general in nature. We provide commentary based on historical data and analyst forecasts only using an unbiased methodology and our articles are not intended to be financial advice. It does not constitute a recommendation to buy or sell any stock, and does not take account of your objectives, or your financial situation. We aim to bring you long-term focused analysis driven by fundamental data. Note that our analysis may not factor in the latest price-sensitive company announcements or qualitative material. Simply Wall St has no position in any stocks mentioned.
