
 Yahoo Finance
 Returns Are Gaining Momentum At Rocky Mountain Liquor (CVE:RUM)
If we want to find a stock that could multiply over the long term, what are the underlying trends we should look for? Firstly, we'd want to identify a growing return on capital employed (ROCE) and then alongside that, an ever-increasing base of capital employed. If you see this, it typically means it's a company with a great business model and plenty of profitable reinvestment opportunities. So when we looked at Rocky Mountain Liquor (CVE:RUM) and its trend of ROCE, we really liked what we saw.
Return On Capital Employed (ROCE): What is it?
Just to clarify if you're unsure, ROCE is a metric for evaluating how much pre-tax income (in percentage terms) a company earns on the capital invested in its business. The formula for this calculation on Rocky Mountain Liquor is:
Return on Capital Employed = Earnings Before Interest and Tax (EBIT) ÷ (Total Assets - Current Liabilities)
0.086 = CA$1.8m ÷ (CA$26m - CA$5.5m) (Based on the trailing twelve months to March 2022).
Therefore, Rocky Mountain Liquor has an ROCE of 8.6%. Ultimately, that's a low return and it under-performs the Consumer Retailing industry average of 12%.
See our latest analysis for Rocky Mountain Liquor
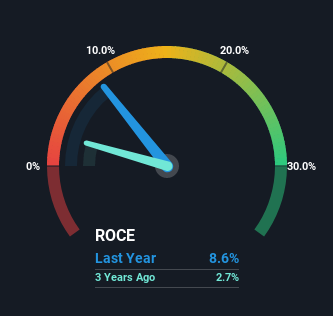
Historical performance is a great place to start when researching a stock so above you can see the gauge for Rocky Mountain Liquor's ROCE against it's prior returns. If you're interested in investigating Rocky Mountain Liquor's past further, check out this free graph of past earnings, revenue and cash flow.
How Are Returns Trending?
The fact that Rocky Mountain Liquor is now generating some pre-tax profits from its prior investments is very encouraging. The company was generating losses five years ago, but now it's earning 8.6% which is a sight for sore eyes. In addition to that, Rocky Mountain Liquor is employing 163% more capital than previously which is expected of a company that's trying to break into profitability. This can tell us that the company has plenty of reinvestment opportunities that are able to generate higher returns.
On a related note, the company's ratio of current liabilities to total assets has decreased to 21%, which basically reduces it's funding from the likes of short-term creditors or suppliers. So this improvement in ROCE has come from the business' underlying economics, which is great to see.
In Conclusion...
Overall, Rocky Mountain Liquor gets a big tick from us thanks in most part to the fact that it is now profitable and is reinvesting in its business. Given the stock has declined 56% in the last five years, this could be a good investment if the valuation and other metrics are also appealing. That being the case, research into the company's current valuation metrics and future prospects seems fitting.
Since virtually every company faces some risks, it's worth knowing what they are, and we've spotted 4 warning signs for Rocky Mountain Liquor (of which 2 shouldn't be ignored!) that you should know about.
If you want to search for solid companies with great earnings, check out this free list of companies with good balance sheets and impressive returns on equity.
Have feedback on this article? Concerned about the content? Get in touch with us directly. Alternatively, email editorial-team (at) simplywallst.com.
This article by Simply Wall St is general in nature. We provide commentary based on historical data and analyst forecasts only using an unbiased methodology and our articles are not intended to be financial advice. It does not constitute a recommendation to buy or sell any stock, and does not take account of your objectives, or your financial situation. We aim to bring you long-term focused analysis driven by fundamental data. Note that our analysis may not factor in the latest price-sensitive company announcements or qualitative material. Simply Wall St has no position in any stocks mentioned.
