
 Yahoo Finance
 Returns Are Gaining Momentum At National Fuel Gas (NYSE:NFG)
Did you know there are some financial metrics that can provide clues of a potential multi-bagger? Amongst other things, we'll want to see two things; firstly, a growing return on capital employed (ROCE) and secondly, an expansion in the company's amount of capital employed. Basically this means that a company has profitable initiatives that it can continue to reinvest in, which is a trait of a compounding machine. So when we looked at National Fuel Gas (NYSE:NFG) and its trend of ROCE, we really liked what we saw.
What Is Return On Capital Employed (ROCE)?
For those that aren't sure what ROCE is, it measures the amount of pre-tax profits a company can generate from the capital employed in its business. Analysts use this formula to calculate it for National Fuel Gas:
Return on Capital Employed = Earnings Before Interest and Tax (EBIT) ÷ (Total Assets - Current Liabilities)
0.13 = US$846m ÷ (US$8.1b - US$1.5b) (Based on the trailing twelve months to December 2022).
Therefore, National Fuel Gas has an ROCE of 13%. On its own, that's a standard return, however it's much better than the 5.5% generated by the Gas Utilities industry.
See our latest analysis for National Fuel Gas
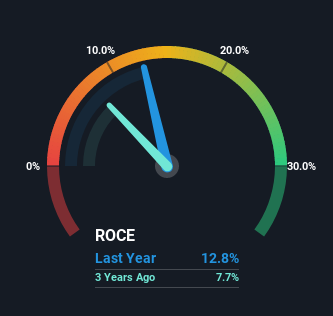
Above you can see how the current ROCE for National Fuel Gas compares to its prior returns on capital, but there's only so much you can tell from the past. If you'd like, you can check out the forecasts from the analysts covering National Fuel Gas here for free.
What The Trend Of ROCE Can Tell Us
Investors would be pleased with what's happening at National Fuel Gas. The data shows that returns on capital have increased substantially over the last five years to 13%. The amount of capital employed has increased too, by 22%. So we're very much inspired by what we're seeing at National Fuel Gas thanks to its ability to profitably reinvest capital.
For the record though, there was a noticeable increase in the company's current liabilities over the period, so we would attribute some of the ROCE growth to that. Effectively this means that suppliers or short-term creditors are now funding 19% of the business, which is more than it was five years ago. It's worth keeping an eye on this because as the percentage of current liabilities to total assets increases, some aspects of risk also increase.
Our Take On National Fuel Gas' ROCE
All in all, it's terrific to see that National Fuel Gas is reaping the rewards from prior investments and is growing its capital base. Considering the stock has delivered 27% to its stockholders over the last five years, it may be fair to think that investors aren't fully aware of the promising trends yet. So with that in mind, we think the stock deserves further research.
National Fuel Gas does have some risks, we noticed 3 warning signs (and 1 which is significant) we think you should know about.
While National Fuel Gas isn't earning the highest return, check out this free list of companies that are earning high returns on equity with solid balance sheets.
Have feedback on this article? Concerned about the content? Get in touch with us directly. Alternatively, email editorial-team (at) simplywallst.com.
This article by Simply Wall St is general in nature. We provide commentary based on historical data and analyst forecasts only using an unbiased methodology and our articles are not intended to be financial advice. It does not constitute a recommendation to buy or sell any stock, and does not take account of your objectives, or your financial situation. We aim to bring you long-term focused analysis driven by fundamental data. Note that our analysis may not factor in the latest price-sensitive company announcements or qualitative material. Simply Wall St has no position in any stocks mentioned.
Join A Paid User Research Session
You’ll receive a US$30 Amazon Gift card for 1 hour of your time while helping us build better investing tools for the individual investors like yourself. Sign up here
