
 Yahoo Finance
 Returns Are Gaining Momentum At Kelt Exploration (TSE:KEL)
Did you know there are some financial metrics that can provide clues of a potential multi-bagger? Ideally, a business will show two trends; firstly a growing return on capital employed (ROCE) and secondly, an increasing amount of capital employed. Put simply, these types of businesses are compounding machines, meaning they are continually reinvesting their earnings at ever-higher rates of return. So on that note, Kelt Exploration (TSE:KEL) looks quite promising in regards to its trends of return on capital.
What Is Return On Capital Employed (ROCE)?
For those that aren't sure what ROCE is, it measures the amount of pre-tax profits a company can generate from the capital employed in its business. The formula for this calculation on Kelt Exploration is:
Return on Capital Employed = Earnings Before Interest and Tax (EBIT) ÷ (Total Assets - Current Liabilities)
0.19 = CA$170m ÷ (CA$1.0b - CA$116m) (Based on the trailing twelve months to June 2022).
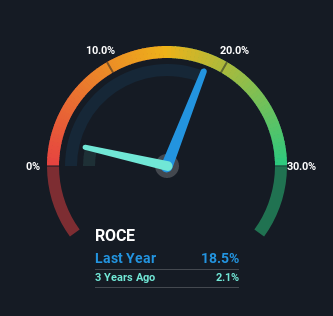
Thus, Kelt Exploration has an ROCE of 19%. That's a pretty standard return and it's in line with the industry average of 19%.
See our latest analysis for Kelt Exploration
In the above chart we have measured Kelt Exploration's prior ROCE against its prior performance, but the future is arguably more important. If you'd like to see what analysts are forecasting going forward, you should check out our free report for Kelt Exploration.
What Can We Tell From Kelt Exploration's ROCE Trend?
We're delighted to see that Kelt Exploration is reaping rewards from its investments and has now broken into profitability. Historically the company was generating losses but as we can see from the latest figures referenced above, they're now earning 19% on their capital employed. In regards to capital employed, Kelt Exploration is using 20% less capital than it was five years ago, which on the surface, can indicate that the business has become more efficient at generating these returns. Kelt Exploration could be selling under-performing assets since the ROCE is improving.
The Key Takeaway
In a nutshell, we're pleased to see that Kelt Exploration has been able to generate higher returns from less capital. And since the stock has fallen 18% over the last five years, there might be an opportunity here. That being the case, research into the company's current valuation metrics and future prospects seems fitting.
If you want to continue researching Kelt Exploration, you might be interested to know about the 1 warning sign that our analysis has discovered.
While Kelt Exploration isn't earning the highest return, check out this free list of companies that are earning high returns on equity with solid balance sheets.
Have feedback on this article? Concerned about the content? Get in touch with us directly. Alternatively, email editorial-team (at) simplywallst.com.
This article by Simply Wall St is general in nature. We provide commentary based on historical data and analyst forecasts only using an unbiased methodology and our articles are not intended to be financial advice. It does not constitute a recommendation to buy or sell any stock, and does not take account of your objectives, or your financial situation. We aim to bring you long-term focused analysis driven by fundamental data. Note that our analysis may not factor in the latest price-sensitive company announcements or qualitative material. Simply Wall St has no position in any stocks mentioned.
Join A Paid User Research Session
You’ll receive a US$30 Amazon Gift card for 1 hour of your time while helping us build better investing tools for the individual investors like yourself. Sign up here
