
 Yahoo Finance
 Returns Are Gaining Momentum At JD.com (NASDAQ:JD)
If we want to find a stock that could multiply over the long term, what are the underlying trends we should look for? In a perfect world, we'd like to see a company investing more capital into its business and ideally the returns earned from that capital are also increasing. Ultimately, this demonstrates that it's a business that is reinvesting profits at increasing rates of return. With that in mind, we've noticed some promising trends at JD.com (NASDAQ:JD) so let's look a bit deeper.
Understanding Return On Capital Employed (ROCE)
For those who don't know, ROCE is a measure of a company's yearly pre-tax profit (its return), relative to the capital employed in the business. Analysts use this formula to calculate it for JD.com:
Return on Capital Employed = Earnings Before Interest and Tax (EBIT) ÷ (Total Assets - Current Liabilities)
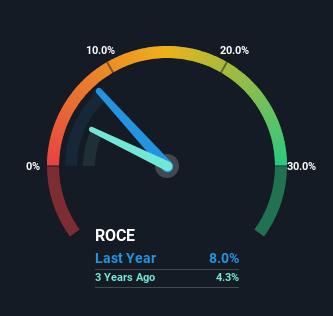
0.08 = CN¥29b ÷ (CN¥629b - CN¥266b) (Based on the trailing twelve months to December 2023).
Thus, JD.com has an ROCE of 8.0%. In absolute terms, that's a low return and it also under-performs the Multiline Retail industry average of 11%.
View our latest analysis for JD.com
In the above chart we have measured JD.com's prior ROCE against its prior performance, but the future is arguably more important. If you'd like, you can check out the forecasts from the analysts covering JD.com for free.
The Trend Of ROCE
The fact that JD.com is now generating some pre-tax profits from its prior investments is very encouraging. The company was generating losses five years ago, but now it's earning 8.0% which is a sight for sore eyes. In addition to that, JD.com is employing 311% more capital than previously which is expected of a company that's trying to break into profitability. This can tell us that the company has plenty of reinvestment opportunities that are able to generate higher returns.
One more thing to note, JD.com has decreased current liabilities to 42% of total assets over this period, which effectively reduces the amount of funding from suppliers or short-term creditors. So this improvement in ROCE has come from the business' underlying economics, which is great to see. However, current liabilities are still at a pretty high level, so just be aware that this can bring with it some risks.
What We Can Learn From JD.com's ROCE
Overall, JD.com gets a big tick from us thanks in most part to the fact that it is now profitable and is reinvesting in its business. Since the total return from the stock has been almost flat over the last five years, there might be an opportunity here if the valuation looks good. So researching this company further and determining whether or not these trends will continue seems justified.
Like most companies, JD.com does come with some risks, and we've found 1 warning sign that you should be aware of.
For those who like to invest in solid companies, check out this free list of companies with solid balance sheets and high returns on equity.
Have feedback on this article? Concerned about the content? Get in touch with us directly. Alternatively, email editorial-team (at) simplywallst.com.
This article by Simply Wall St is general in nature. We provide commentary based on historical data and analyst forecasts only using an unbiased methodology and our articles are not intended to be financial advice. It does not constitute a recommendation to buy or sell any stock, and does not take account of your objectives, or your financial situation. We aim to bring you long-term focused analysis driven by fundamental data. Note that our analysis may not factor in the latest price-sensitive company announcements or qualitative material. Simply Wall St has no position in any stocks mentioned.
