
 Yahoo Finance
 Returns At Finning International (TSE:FTT) Are On The Way Up
If you're not sure where to start when looking for the next multi-bagger, there are a few key trends you should keep an eye out for. One common approach is to try and find a company with returns on capital employed (ROCE) that are increasing, in conjunction with a growing amount of capital employed. Basically this means that a company has profitable initiatives that it can continue to reinvest in, which is a trait of a compounding machine. Speaking of which, we noticed some great changes in Finning International's (TSE:FTT) returns on capital, so let's have a look.
Return On Capital Employed (ROCE): What Is It?
For those that aren't sure what ROCE is, it measures the amount of pre-tax profits a company can generate from the capital employed in its business. Analysts use this formula to calculate it for Finning International:
Return on Capital Employed = Earnings Before Interest and Tax (EBIT) ÷ (Total Assets - Current Liabilities)
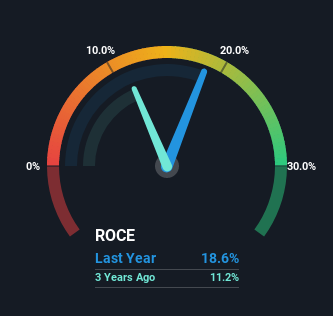
0.19 = CA$711m ÷ (CA$7.0b - CA$3.2b) (Based on the trailing twelve months to September 2022).
Thus, Finning International has an ROCE of 19%. That's a pretty standard return and it's in line with the industry average of 19%.
See our latest analysis for Finning International
In the above chart we have measured Finning International's prior ROCE against its prior performance, but the future is arguably more important. If you're interested, you can view the analysts predictions in our free report on analyst forecasts for the company.
The Trend Of ROCE
Finning International is showing promise given that its ROCE is trending up and to the right. More specifically, while the company has kept capital employed relatively flat over the last five years, the ROCE has climbed 88% in that same time. So our take on this is that the business has increased efficiencies to generate these higher returns, all the while not needing to make any additional investments. On that front, things are looking good so it's worth exploring what management has said about growth plans going forward.
For the record though, there was a noticeable increase in the company's current liabilities over the period, so we would attribute some of the ROCE growth to that. The current liabilities has increased to 46% of total assets, so the business is now more funded by the likes of its suppliers or short-term creditors. Given it's pretty high ratio, we'd remind investors that having current liabilities at those levels can bring about some risks in certain businesses.
The Bottom Line
In summary, we're delighted to see that Finning International has been able to increase efficiencies and earn higher rates of return on the same amount of capital. Investors may not be impressed by the favorable underlying trends yet because over the last five years the stock has only returned 23% to shareholders. So exploring more about this stock could uncover a good opportunity, if the valuation and other metrics stack up.
If you'd like to know more about Finning International, we've spotted 3 warning signs, and 2 of them are significant.
While Finning International may not currently earn the highest returns, we've compiled a list of companies that currently earn more than 25% return on equity. Check out this free list here.
Have feedback on this article? Concerned about the content? Get in touch with us directly. Alternatively, email editorial-team (at) simplywallst.com.
This article by Simply Wall St is general in nature. We provide commentary based on historical data and analyst forecasts only using an unbiased methodology and our articles are not intended to be financial advice. It does not constitute a recommendation to buy or sell any stock, and does not take account of your objectives, or your financial situation. We aim to bring you long-term focused analysis driven by fundamental data. Note that our analysis may not factor in the latest price-sensitive company announcements or qualitative material. Simply Wall St has no position in any stocks mentioned.
Join A Paid User Research Session
You’ll receive a US$30 Amazon Gift card for 1 hour of your time while helping us build better investing tools for the individual investors like yourself. Sign up here
