
 Yahoo Finance
 Returns At CarGurus (NASDAQ:CARG) Appear To Be Weighed Down
Did you know there are some financial metrics that can provide clues of a potential multi-bagger? Typically, we'll want to notice a trend of growing return on capital employed (ROCE) and alongside that, an expanding base of capital employed. Put simply, these types of businesses are compounding machines, meaning they are continually reinvesting their earnings at ever-higher rates of return. Having said that, from a first glance at CarGurus (NASDAQ:CARG) we aren't jumping out of our chairs at how returns are trending, but let's have a deeper look.
Return On Capital Employed (ROCE): What Is It?
If you haven't worked with ROCE before, it measures the 'return' (pre-tax profit) a company generates from capital employed in its business. To calculate this metric for CarGurus, this is the formula:
Return on Capital Employed = Earnings Before Interest and Tax (EBIT) ÷ (Total Assets - Current Liabilities)
0.097 = US$90m ÷ (US$1.0b - US$111m) (Based on the trailing twelve months to June 2023).
Therefore, CarGurus has an ROCE of 9.7%. In absolute terms, that's a low return, but it's much better than the Interactive Media and Services industry average of 7.0%.
View our latest analysis for CarGurus
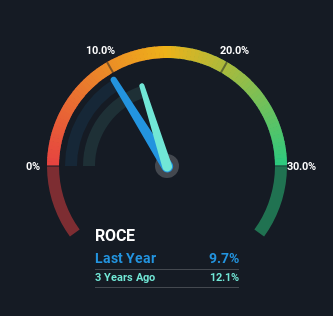
Above you can see how the current ROCE for CarGurus compares to its prior returns on capital, but there's only so much you can tell from the past. If you'd like, you can check out the forecasts from the analysts covering CarGurus here for free.
What Does the ROCE Trend For CarGurus Tell Us?
There are better returns on capital out there than what we're seeing at CarGurus. Over the past five years, ROCE has remained relatively flat at around 9.7% and the business has deployed 471% more capital into its operations. Given the company has increased the amount of capital employed, it appears the investments that have been made simply don't provide a high return on capital.
One more thing to note, even though ROCE has remained relatively flat over the last five years, the reduction in current liabilities to 11% of total assets, is good to see from a business owner's perspective. Effectively suppliers now fund less of the business, which can lower some elements of risk.
The Bottom Line
In summary, CarGurus has simply been reinvesting capital and generating the same low rate of return as before. And investors appear hesitant that the trends will pick up because the stock has fallen 65% in the last five years. In any case, the stock doesn't have these traits of a multi-bagger discussed above, so if that's what you're looking for, we think you'd have more luck elsewhere.
Like most companies, CarGurus does come with some risks, and we've found 1 warning sign that you should be aware of.
While CarGurus may not currently earn the highest returns, we've compiled a list of companies that currently earn more than 25% return on equity. Check out this free list here.
Have feedback on this article? Concerned about the content? Get in touch with us directly. Alternatively, email editorial-team (at) simplywallst.com.
This article by Simply Wall St is general in nature. We provide commentary based on historical data and analyst forecasts only using an unbiased methodology and our articles are not intended to be financial advice. It does not constitute a recommendation to buy or sell any stock, and does not take account of your objectives, or your financial situation. We aim to bring you long-term focused analysis driven by fundamental data. Note that our analysis may not factor in the latest price-sensitive company announcements or qualitative material. Simply Wall St has no position in any stocks mentioned.
