
 Yahoo Finance
 The Returns On Capital At Wilhelmina International (NASDAQ:WHLM) Don't Inspire Confidence
If we're looking to avoid a business that is in decline, what are the trends that can warn us ahead of time? Businesses in decline often have two underlying trends, firstly, a declining return on capital employed (ROCE) and a declining base of capital employed. Basically the company is earning less on its investments and it is also reducing its total assets. So after glancing at the trends within Wilhelmina International (NASDAQ:WHLM), we weren't too hopeful.
Understanding Return On Capital Employed (ROCE)
If you haven't worked with ROCE before, it measures the 'return' (pre-tax profit) a company generates from capital employed in its business. Analysts use this formula to calculate it for Wilhelmina International:
Return on Capital Employed = Earnings Before Interest and Tax (EBIT) ÷ (Total Assets - Current Liabilities)
0.025 = US$728k ÷ (US$42m - US$12m) (Based on the trailing twelve months to December 2023).
Thus, Wilhelmina International has an ROCE of 2.5%. In absolute terms, that's a low return and it also under-performs the Commercial Services industry average of 10%.
Check out our latest analysis for Wilhelmina International
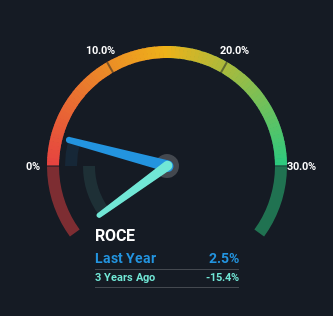
Historical performance is a great place to start when researching a stock so above you can see the gauge for Wilhelmina International's ROCE against it's prior returns. If you want to delve into the historical earnings , check out these free graphs detailing revenue and cash flow performance of Wilhelmina International.
How Are Returns Trending?
In terms of Wilhelmina International's historical ROCE movements, the trend doesn't inspire confidence. Unfortunately the returns on capital have diminished from the 4.8% that they were earning five years ago. And on the capital employed front, the business is utilizing roughly the same amount of capital as it was back then. Companies that exhibit these attributes tend to not be shrinking, but they can be mature and facing pressure on their margins from competition. If these trends continue, we wouldn't expect Wilhelmina International to turn into a multi-bagger.
Our Take On Wilhelmina International's ROCE
In summary, it's unfortunate that Wilhelmina International is generating lower returns from the same amount of capital. Investors haven't taken kindly to these developments, since the stock has declined 30% from where it was five years ago. Unless there is a shift to a more positive trajectory in these metrics, we would look elsewhere.
One more thing to note, we've identified 3 warning signs with Wilhelmina International and understanding these should be part of your investment process.
If you want to search for solid companies with great earnings, check out this free list of companies with good balance sheets and impressive returns on equity.
Have feedback on this article? Concerned about the content? Get in touch with us directly. Alternatively, email editorial-team (at) simplywallst.com.
This article by Simply Wall St is general in nature. We provide commentary based on historical data and analyst forecasts only using an unbiased methodology and our articles are not intended to be financial advice. It does not constitute a recommendation to buy or sell any stock, and does not take account of your objectives, or your financial situation. We aim to bring you long-term focused analysis driven by fundamental data. Note that our analysis may not factor in the latest price-sensitive company announcements or qualitative material. Simply Wall St has no position in any stocks mentioned.
