
 Yahoo Finance
 Returns On Capital At Union Pacific (NYSE:UNP) Have Hit The Brakes
There are a few key trends to look for if we want to identify the next multi-bagger. Amongst other things, we'll want to see two things; firstly, a growing return on capital employed (ROCE) and secondly, an expansion in the company's amount of capital employed. If you see this, it typically means it's a company with a great business model and plenty of profitable reinvestment opportunities. Having said that, from a first glance at Union Pacific (NYSE:UNP) we aren't jumping out of our chairs at how returns are trending, but let's have a deeper look.
Return On Capital Employed (ROCE): What Is It?
Just to clarify if you're unsure, ROCE is a metric for evaluating how much pre-tax income (in percentage terms) a company earns on the capital invested in its business. The formula for this calculation on Union Pacific is:
Return on Capital Employed = Earnings Before Interest and Tax (EBIT) ÷ (Total Assets - Current Liabilities)
0.15 = US$9.2b ÷ (US$67b - US$4.5b) (Based on the trailing twelve months to March 2024).
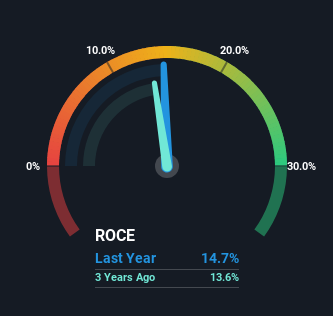
So, Union Pacific has an ROCE of 15%. In absolute terms, that's a satisfactory return, but compared to the Transportation industry average of 8.2% it's much better.
View our latest analysis for Union Pacific
In the above chart we have measured Union Pacific's prior ROCE against its prior performance, but the future is arguably more important. If you'd like to see what analysts are forecasting going forward, you should check out our free analyst report for Union Pacific .
What Can We Tell From Union Pacific's ROCE Trend?
There hasn't been much to report for Union Pacific's returns and its level of capital employed because both metrics have been steady for the past five years. Businesses with these traits tend to be mature and steady operations because they're past the growth phase. So unless we see a substantial change at Union Pacific in terms of ROCE and additional investments being made, we wouldn't hold our breath on it being a multi-bagger. With fewer investment opportunities, it makes sense that Union Pacific has been paying out a decent 41% of its earnings to shareholders. Unless businesses have highly compelling growth opportunities, they'll typically return some money to shareholders.
The Bottom Line
In a nutshell, Union Pacific has been trudging along with the same returns from the same amount of capital over the last five years. Although the market must be expecting these trends to improve because the stock has gained 58% over the last five years. However, unless these underlying trends turn more positive, we wouldn't get our hopes up too high.
If you want to continue researching Union Pacific, you might be interested to know about the 1 warning sign that our analysis has discovered.
If you want to search for solid companies with great earnings, check out this free list of companies with good balance sheets and impressive returns on equity.
Have feedback on this article? Concerned about the content? Get in touch with us directly. Alternatively, email editorial-team (at) simplywallst.com.
This article by Simply Wall St is general in nature. We provide commentary based on historical data and analyst forecasts only using an unbiased methodology and our articles are not intended to be financial advice. It does not constitute a recommendation to buy or sell any stock, and does not take account of your objectives, or your financial situation. We aim to bring you long-term focused analysis driven by fundamental data. Note that our analysis may not factor in the latest price-sensitive company announcements or qualitative material. Simply Wall St has no position in any stocks mentioned.
