
 Yahoo Finance
 What Do The Returns On Capital At Tutor Perini (NYSE:TPC) Tell Us?

If you're looking for a multi-bagger, there's a few things to keep an eye out for. Firstly, we'll want to see a proven return on capital employed (ROCE) that is increasing, and secondly, an expanding base of capital employed. Ultimately, this demonstrates that it's a business that is reinvesting profits at increasing rates of return. Having said that, from a first glance at Tutor Perini (NYSE:TPC) we aren't jumping out of our chairs at how returns are trending, but let's have a deeper look.
What is Return On Capital Employed (ROCE)?
If you haven't worked with ROCE before, it measures the 'return' (pre-tax profit) a company generates from capital employed in its business. The formula for this calculation on Tutor Perini is:
Return on Capital Employed = Earnings Before Interest and Tax (EBIT) ÷ (Total Assets - Current Liabilities)
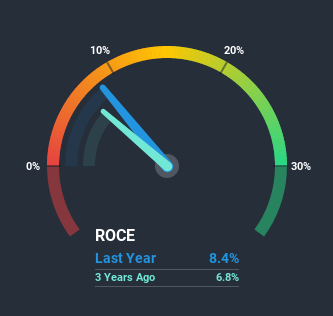
0.084 = US$188m ÷ (US$4.8b - US$2.5b) (Based on the trailing twelve months to June 2020).
Thus, Tutor Perini has an ROCE of 8.4%. In absolute terms, that's a low return but it's around the Construction industry average of 10%.
View our latest analysis for Tutor Perini
Above you can see how the current ROCE for Tutor Perini compares to its prior returns on capital, but there's only so much you can tell from the past. If you'd like to see what analysts are forecasting going forward, you should check out our free report for Tutor Perini.
How Are Returns Trending?
There hasn't been much to report for Tutor Perini's returns and its level of capital employed because both metrics have been steady for the past five years. Businesses with these traits tend to be mature and steady operations because they're past the growth phase. So don't be surprised if Tutor Perini doesn't end up being a multi-bagger in a few years time.
On another note, while the change in ROCE trend might not scream for attention, it's interesting that the current liabilities have actually gone up over the last five years. This is intriguing because if current liabilities hadn't increased to 53% of total assets, this reported ROCE would probably be less than8.4% because total capital employed would be higher.The 8.4% ROCE could be even lower if current liabilities weren't 53% of total assets, because the the formula would show a larger base of total capital employed. Additionally, this high level of current liabilities isn't ideal because it means the company's suppliers (or short-term creditors) are effectively funding a large portion of the business.
The Bottom Line
In summary, Tutor Perini isn't compounding its earnings but is generating stable returns on the same amount of capital employed. And in the last five years, the stock has given away 20% so the market doesn't look too hopeful on these trends strengthening any time soon. On the whole, we aren't too inspired by the underlying trends and we think there may be better chances of finding a multi-bagger elsewhere.
Tutor Perini does have some risks, we noticed 2 warning signs (and 1 which is concerning) we think you should know about.
If you want to search for solid companies with great earnings, check out this free list of companies with good balance sheets and impressive returns on equity.
This article by Simply Wall St is general in nature. It does not constitute a recommendation to buy or sell any stock, and does not take account of your objectives, or your financial situation. We aim to bring you long-term focused analysis driven by fundamental data. Note that our analysis may not factor in the latest price-sensitive company announcements or qualitative material. Simply Wall St has no position in any stocks mentioned.
Have feedback on this article? Concerned about the content? Get in touch with us directly. Alternatively, email editorial-team@simplywallst.com.
