
 Yahoo Finance
 Returns On Capital At Strategic Minerals (LON:SML) Paint A Concerning Picture
Did you know there are some financial metrics that can provide clues of a potential multi-bagger? Firstly, we'd want to identify a growing return on capital employed (ROCE) and then alongside that, an ever-increasing base of capital employed. This shows us that it's a compounding machine, able to continually reinvest its earnings back into the business and generate higher returns. However, after briefly looking over the numbers, we don't think Strategic Minerals (LON:SML) has the makings of a multi-bagger going forward, but let's have a look at why that may be.
Return On Capital Employed (ROCE): What Is It?
For those that aren't sure what ROCE is, it measures the amount of pre-tax profits a company can generate from the capital employed in its business. The formula for this calculation on Strategic Minerals is:
Return on Capital Employed = Earnings Before Interest and Tax (EBIT) ÷ (Total Assets - Current Liabilities)
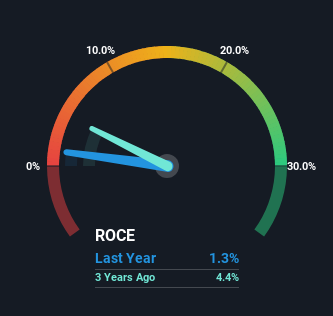
0.013 = US$186k ÷ (US$15m - US$944k) (Based on the trailing twelve months to June 2023).
Therefore, Strategic Minerals has an ROCE of 1.3%. Ultimately, that's a low return and it under-performs the Metals and Mining industry average of 7.7%.
View our latest analysis for Strategic Minerals
While the past is not representative of the future, it can be helpful to know how a company has performed historically, which is why we have this chart above. If you'd like to look at how Strategic Minerals has performed in the past in other metrics, you can view this free graph of Strategic Minerals' past earnings, revenue and cash flow.
What Does the ROCE Trend For Strategic Minerals Tell Us?
When we looked at the ROCE trend at Strategic Minerals, we didn't gain much confidence. Over the last five years, returns on capital have decreased to 1.3% from 22% five years ago. Given the business is employing more capital while revenue has slipped, this is a bit concerning. This could mean that the business is losing its competitive advantage or market share, because while more money is being put into ventures, it's actually producing a lower return - "less bang for their buck" per se.
What We Can Learn From Strategic Minerals' ROCE
We're a bit apprehensive about Strategic Minerals because despite more capital being deployed in the business, returns on that capital and sales have both fallen. This could explain why the stock has sunk a total of 85% in the last five years. With underlying trends that aren't great in these areas, we'd consider looking elsewhere.
One more thing: We've identified 4 warning signs with Strategic Minerals (at least 3 which shouldn't be ignored) , and understanding these would certainly be useful.
If you want to search for solid companies with great earnings, check out this free list of companies with good balance sheets and impressive returns on equity.
Have feedback on this article? Concerned about the content? Get in touch with us directly. Alternatively, email editorial-team (at) simplywallst.com.
This article by Simply Wall St is general in nature. We provide commentary based on historical data and analyst forecasts only using an unbiased methodology and our articles are not intended to be financial advice. It does not constitute a recommendation to buy or sell any stock, and does not take account of your objectives, or your financial situation. We aim to bring you long-term focused analysis driven by fundamental data. Note that our analysis may not factor in the latest price-sensitive company announcements or qualitative material. Simply Wall St has no position in any stocks mentioned.
