
 Yahoo Finance
 Returns On Capital Are A Standout For Tirupati Graphite (LON:TGR)
If we want to find a potential multi-bagger, often there are underlying trends that can provide clues. Amongst other things, we'll want to see two things; firstly, a growing return on capital employed (ROCE) and secondly, an expansion in the company's amount of capital employed. This shows us that it's a compounding machine, able to continually reinvest its earnings back into the business and generate higher returns. Speaking of which, we noticed some great changes in Tirupati Graphite's (LON:TGR) returns on capital, so let's have a look.
Return On Capital Employed (ROCE): What Is It?
Just to clarify if you're unsure, ROCE is a metric for evaluating how much pre-tax income (in percentage terms) a company earns on the capital invested in its business. Analysts use this formula to calculate it for Tirupati Graphite:
Return on Capital Employed = Earnings Before Interest and Tax (EBIT) ÷ (Total Assets - Current Liabilities)
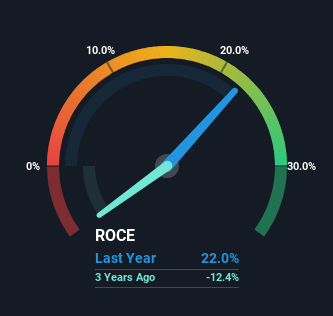
0.22 = UK£7.3m ÷ (UK£36m - UK£3.3m) (Based on the trailing twelve months to September 2023).
Therefore, Tirupati Graphite has an ROCE of 22%. That's a fantastic return and not only that, it outpaces the average of 12% earned by companies in a similar industry.
View our latest analysis for Tirupati Graphite
While the past is not representative of the future, it can be helpful to know how a company has performed historically, which is why we have this chart above. If you're interested in investigating Tirupati Graphite's past further, check out this free graph of past earnings, revenue and cash flow.
What Does the ROCE Trend For Tirupati Graphite Tell Us?
The fact that Tirupati Graphite is now generating some pre-tax profits from its prior investments is very encouraging. The company was generating losses five years ago, but now it's earning 22% which is a sight for sore eyes. In addition to that, Tirupati Graphite is employing 673% more capital than previously which is expected of a company that's trying to break into profitability. This can indicate that there's plenty of opportunities to invest capital internally and at ever higher rates, both common traits of a multi-bagger.
The Bottom Line On Tirupati Graphite's ROCE
To the delight of most shareholders, Tirupati Graphite has now broken into profitability. Although the company may be facing some issues elsewhere since the stock has plunged 75% in the last three years. In any case, we believe the economic trends of this company are positive and looking into the stock further could prove rewarding.
If you'd like to know more about Tirupati Graphite, we've spotted 4 warning signs, and 2 of them are potentially serious.
If you'd like to see other companies earning high returns, check out our free list of companies earning high returns with solid balance sheets here.
Have feedback on this article? Concerned about the content? Get in touch with us directly. Alternatively, email editorial-team (at) simplywallst.com.
This article by Simply Wall St is general in nature. We provide commentary based on historical data and analyst forecasts only using an unbiased methodology and our articles are not intended to be financial advice. It does not constitute a recommendation to buy or sell any stock, and does not take account of your objectives, or your financial situation. We aim to bring you long-term focused analysis driven by fundamental data. Note that our analysis may not factor in the latest price-sensitive company announcements or qualitative material. Simply Wall St has no position in any stocks mentioned.
