
 Yahoo Finance
 Returns On Capital Are A Standout For Imaflex (CVE:IFX)
If you're looking for a multi-bagger, there's a few things to keep an eye out for. Firstly, we'd want to identify a growing return on capital employed (ROCE) and then alongside that, an ever-increasing base of capital employed. This shows us that it's a compounding machine, able to continually reinvest its earnings back into the business and generate higher returns. With that in mind, the ROCE of Imaflex (CVE:IFX) looks great, so lets see what the trend can tell us.
Understanding Return On Capital Employed (ROCE)
If you haven't worked with ROCE before, it measures the 'return' (pre-tax profit) a company generates from capital employed in its business. To calculate this metric for Imaflex, this is the formula:
Return on Capital Employed = Earnings Before Interest and Tax (EBIT) ÷ (Total Assets - Current Liabilities)
0.22 = CA$10m ÷ (CA$61m - CA$16m) (Based on the trailing twelve months to March 2021).
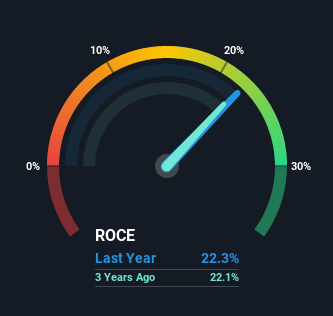
Therefore, Imaflex has an ROCE of 22%. That's a fantastic return and not only that, it outpaces the average of 14% earned by companies in a similar industry.
Check out our latest analysis for Imaflex
Above you can see how the current ROCE for Imaflex compares to its prior returns on capital, but there's only so much you can tell from the past. If you're interested, you can view the analysts predictions in our free report on analyst forecasts for the company.
What Does the ROCE Trend For Imaflex Tell Us?
The trends we've noticed at Imaflex are quite reassuring. The numbers show that in the last five years, the returns generated on capital employed have grown considerably to 22%. The company is effectively making more money per dollar of capital used, and it's worth noting that the amount of capital has increased too, by 81%. So we're very much inspired by what we're seeing at Imaflex thanks to its ability to profitably reinvest capital.
In another part of our analysis, we noticed that the company's ratio of current liabilities to total assets decreased to 25%, which broadly means the business is relying less on its suppliers or short-term creditors to fund its operations. So this improvement in ROCE has come from the business' underlying economics, which is great to see.
The Bottom Line
To sum it up, Imaflex has proven it can reinvest in the business and generate higher returns on that capital employed, which is terrific. Since the stock has returned a staggering 348% to shareholders over the last five years, it looks like investors are recognizing these changes. In light of that, we think it's worth looking further into this stock because if Imaflex can keep these trends up, it could have a bright future ahead.
If you want to continue researching Imaflex, you might be interested to know about the 2 warning signs that our analysis has discovered.
High returns are a key ingredient to strong performance, so check out our free list ofstocks earning high returns on equity with solid balance sheets.
This article by Simply Wall St is general in nature. It does not constitute a recommendation to buy or sell any stock, and does not take account of your objectives, or your financial situation. We aim to bring you long-term focused analysis driven by fundamental data. Note that our analysis may not factor in the latest price-sensitive company announcements or qualitative material. Simply Wall St has no position in any stocks mentioned.
Have feedback on this article? Concerned about the content? Get in touch with us directly. Alternatively, email editorial-team (at) simplywallst.com.
