
 Yahoo Finance
 Returns On Capital Signal Tricky Times Ahead For TransAct Technologies (NASDAQ:TACT)
If you're looking for a multi-bagger, there's a few things to keep an eye out for. Typically, we'll want to notice a trend of growing return on capital employed (ROCE) and alongside that, an expanding base of capital employed. If you see this, it typically means it's a company with a great business model and plenty of profitable reinvestment opportunities. Having said that, from a first glance at TransAct Technologies (NASDAQ:TACT) we aren't jumping out of our chairs at how returns are trending, but let's have a deeper look.
Understanding Return On Capital Employed (ROCE)
For those who don't know, ROCE is a measure of a company's yearly pre-tax profit (its return), relative to the capital employed in the business. Analysts use this formula to calculate it for TransAct Technologies:
Return on Capital Employed = Earnings Before Interest and Tax (EBIT) ÷ (Total Assets - Current Liabilities)
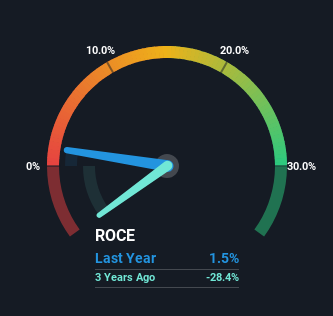
0.015 = US$592k ÷ (US$52m - US$12m) (Based on the trailing twelve months to March 2024).
Thus, TransAct Technologies has an ROCE of 1.5%. In absolute terms, that's a low return and it also under-performs the Tech industry average of 8.3%.
See our latest analysis for TransAct Technologies
Above you can see how the current ROCE for TransAct Technologies compares to its prior returns on capital, but there's only so much you can tell from the past. If you're interested, you can view the analysts predictions in our free analyst report for TransAct Technologies .
What Can We Tell From TransAct Technologies' ROCE Trend?
On the surface, the trend of ROCE at TransAct Technologies doesn't inspire confidence. Over the last five years, returns on capital have decreased to 1.5% from 22% five years ago. And considering revenue has dropped while employing more capital, we'd be cautious. This could mean that the business is losing its competitive advantage or market share, because while more money is being put into ventures, it's actually producing a lower return - "less bang for their buck" per se.
In Conclusion...
From the above analysis, we find it rather worrisome that returns on capital and sales for TransAct Technologies have fallen, meanwhile the business is employing more capital than it was five years ago. It should come as no surprise then that the stock has fallen 69% over the last five years, so it looks like investors are recognizing these changes. That being the case, unless the underlying trends revert to a more positive trajectory, we'd consider looking elsewhere.
TransAct Technologies does have some risks, we noticed 5 warning signs (and 1 which doesn't sit too well with us) we think you should know about.
If you want to search for solid companies with great earnings, check out this free list of companies with good balance sheets and impressive returns on equity.
Have feedback on this article? Concerned about the content? Get in touch with us directly. Alternatively, email editorial-team (at) simplywallst.com.
This article by Simply Wall St is general in nature. We provide commentary based on historical data and analyst forecasts only using an unbiased methodology and our articles are not intended to be financial advice. It does not constitute a recommendation to buy or sell any stock, and does not take account of your objectives, or your financial situation. We aim to bring you long-term focused analysis driven by fundamental data. Note that our analysis may not factor in the latest price-sensitive company announcements or qualitative material. Simply Wall St has no position in any stocks mentioned.
Have feedback on this article? Concerned about the content? Get in touch with us directly. Alternatively, email editorial-team@simplywallst.com
