
 Yahoo Finance
 Returns On Capital Signal Difficult Times Ahead For Cameco (TSE:CCO)
If we're looking to avoid a business that is in decline, what are the trends that can warn us ahead of time? A business that's potentially in decline often shows two trends, a return on capital employed (ROCE) that's declining, and a base of capital employed that's also declining. This indicates the company is producing less profit from its investments and its total assets are decreasing. So after glancing at the trends within Cameco ( TSE:CCO ), we weren't too hopeful.
What is Return On Capital Employed (ROCE)?
Just to clarify if you're unsure, ROCE is a metric for evaluating how much pre-tax income (in percentage terms) a company earns on the capital invested in its business. Analysts use this formula to calculate it for Cameco:
Return on Capital Employed = Earnings Before Interest and Tax (EBIT) ÷ (Total Assets - Current Liabilities)
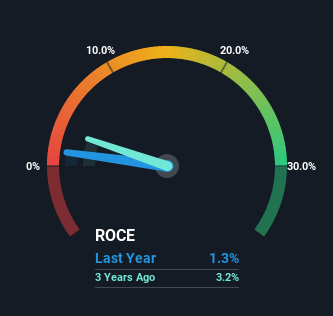
0.013 = CA$91m ÷ (CA$7.5b - CA$434m) (Based on the trailing twelve months to March 2022) .
So, Cameco has an ROCE of 1.3%. In absolute terms, that's a low return and it also under-performs the Oil, Gas & Consumable Fuels industry average of 12%.
See our latest analysis for Cameco
In the above chart we have measured Cameco's prior ROCE against its prior performance, but the future is arguably more important. If you'd like, you can check out the forecasts from the analysts covering Cameco here for free.
What The Trend Of ROCE Can Tell Us
In terms of Cameco's historical ROCE movements, the trend doesn't inspire confidence. To be more specific, the ROCE was 3.1% five years ago, but since then it has dropped noticeably. On top of that, it's worth noting that the amount of capital employed within the business has remained relatively steady. Since returns are falling and the business has the same amount of assets employed, this can suggest it's a mature business that hasn't had much growth in the last five years. If these trends continue, we wouldn't expect Cameco to turn into a multi-bagger.
The Key Takeaway
All in all, the lower returns from the same amount of capital employed aren't exactly signs of a compounding machine. Yet despite these poor fundamentals, the stock has gained a huge 150% over the last five years, so investors appear very optimistic. In any case, the current underlying trends don't bode well for long term performance so unless they reverse, we'd start looking elsewhere.
One more thing, we've spotted 1 warning sign facing Cameco that you might find interesting.
While Cameco isn't earning the highest return, check out this free list of companies that are earning high returns on equity with solid balance sheets.
Have feedback on this article? Concerned about the content? Get in touch with us directly. Alternatively, email editorial-team (at) simplywallst.com.
This article by Simply Wall St is general in nature. We provide commentary based on historical data and analyst forecasts only using an unbiased methodology and our articles are not intended to be financial advice. It does not constitute a recommendation to buy or sell any stock, and does not take account of your objectives, or your financial situation. We aim to bring you long-term focused analysis driven by fundamental data. Note that our analysis may not factor in the latest price-sensitive company announcements or qualitative material. Simply Wall St has no position in any stocks mentioned.
