
 Yahoo Finance
 Returns On Capital Are Showing Encouraging Signs At MYR Group (NASDAQ:MYRG)
What are the early trends we should look for to identify a stock that could multiply in value over the long term? One common approach is to try and find a company with returns on capital employed (ROCE) that are increasing, in conjunction with a growing amount of capital employed. Put simply, these types of businesses are compounding machines, meaning they are continually reinvesting their earnings at ever-higher rates of return. So on that note, MYR Group (NASDAQ:MYRG) looks quite promising in regards to its trends of return on capital.
What Is Return On Capital Employed (ROCE)?
Just to clarify if you're unsure, ROCE is a metric for evaluating how much pre-tax income (in percentage terms) a company earns on the capital invested in its business. Analysts use this formula to calculate it for MYR Group:
Return on Capital Employed = Earnings Before Interest and Tax (EBIT) ÷ (Total Assets - Current Liabilities)
0.14 = US$121m ÷ (US$1.6b - US$732m) (Based on the trailing twelve months to March 2024).
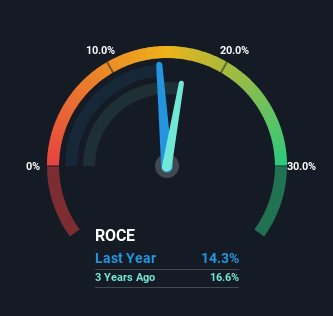
Thus, MYR Group has an ROCE of 14%. In absolute terms, that's a pretty normal return, and it's somewhat close to the Construction industry average of 12%.
Check out our latest analysis for MYR Group
Above you can see how the current ROCE for MYR Group compares to its prior returns on capital, but there's only so much you can tell from the past. If you'd like to see what analysts are forecasting going forward, you should check out our free analyst report for MYR Group .
What Can We Tell From MYR Group's ROCE Trend?
The trends we've noticed at MYR Group are quite reassuring. The numbers show that in the last five years, the returns generated on capital employed have grown considerably to 14%. The company is effectively making more money per dollar of capital used, and it's worth noting that the amount of capital has increased too, by 70%. This can indicate that there's plenty of opportunities to invest capital internally and at ever higher rates, a combination that's common among multi-baggers.
On a separate but related note, it's important to know that MYR Group has a current liabilities to total assets ratio of 46%, which we'd consider pretty high. This can bring about some risks because the company is basically operating with a rather large reliance on its suppliers or other sorts of short-term creditors. While it's not necessarily a bad thing, it can be beneficial if this ratio is lower.
The Bottom Line On MYR Group's ROCE
To sum it up, MYR Group has proven it can reinvest in the business and generate higher returns on that capital employed, which is terrific. And a remarkable 289% total return over the last five years tells us that investors are expecting more good things to come in the future. Therefore, we think it would be worth your time to check if these trends are going to continue.
If you'd like to know about the risks facing MYR Group, we've discovered 1 warning sign that you should be aware of.
For those who like to invest in solid companies, check out this free list of companies with solid balance sheets and high returns on equity.
Have feedback on this article? Concerned about the content? Get in touch with us directly. Alternatively, email editorial-team (at) simplywallst.com.
This article by Simply Wall St is general in nature. We provide commentary based on historical data and analyst forecasts only using an unbiased methodology and our articles are not intended to be financial advice. It does not constitute a recommendation to buy or sell any stock, and does not take account of your objectives, or your financial situation. We aim to bring you long-term focused analysis driven by fundamental data. Note that our analysis may not factor in the latest price-sensitive company announcements or qualitative material. Simply Wall St has no position in any stocks mentioned.
Have feedback on this article? Concerned about the content? Get in touch with us directly. Alternatively, email editorial-team@simplywallst.com
