
 Yahoo Finance
 Returns On Capital Are Showing Encouraging Signs At Top Ships (NASDAQ:TOPS)
If we want to find a stock that could multiply over the long term, what are the underlying trends we should look for? Amongst other things, we'll want to see two things; firstly, a growing return on capital employed (ROCE) and secondly, an expansion in the company's amount of capital employed. This shows us that it's a compounding machine, able to continually reinvest its earnings back into the business and generate higher returns. So on that note, Top Ships (NASDAQ:TOPS) looks quite promising in regards to its trends of return on capital.
Understanding Return On Capital Employed (ROCE)
Just to clarify if you're unsure, ROCE is a metric for evaluating how much pre-tax income (in percentage terms) a company earns on the capital invested in its business. Analysts use this formula to calculate it for Top Ships:
Return on Capital Employed = Earnings Before Interest and Tax (EBIT) ÷ (Total Assets - Current Liabilities)
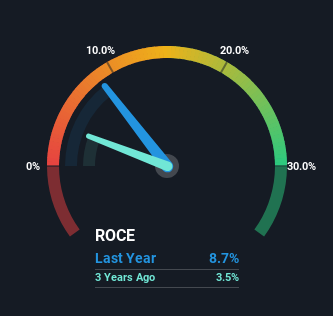
0.087 = US$34m ÷ (US$446m - US$57m) (Based on the trailing twelve months to June 2023).
So, Top Ships has an ROCE of 8.7%. In absolute terms, that's a low return and it also under-performs the Oil and Gas industry average of 16%.
View our latest analysis for Top Ships
In the above chart we have measured Top Ships' prior ROCE against its prior performance, but the future is arguably more important. If you'd like to see what analysts are forecasting going forward, you should check out our free report for Top Ships.
What Can We Tell From Top Ships' ROCE Trend?
The fact that Top Ships is now generating some pre-tax profits from its prior investments is very encouraging. The company was generating losses five years ago, but now it's earning 8.7% which is a sight for sore eyes. And unsurprisingly, like most companies trying to break into the black, Top Ships is utilizing 112% more capital than it was five years ago. This can tell us that the company has plenty of reinvestment opportunities that are able to generate higher returns.
What We Can Learn From Top Ships' ROCE
In summary, it's great to see that Top Ships has managed to break into profitability and is continuing to reinvest in its business. And since the stock has dived 100% over the last five years, there may be other factors affecting the company's prospects. Still, it's worth doing some further research to see if the trends will continue into the future.
One more thing: We've identified 4 warning signs with Top Ships (at least 2 which make us uncomfortable) , and understanding these would certainly be useful.
If you want to search for solid companies with great earnings, check out this free list of companies with good balance sheets and impressive returns on equity.
Have feedback on this article? Concerned about the content? Get in touch with us directly. Alternatively, email editorial-team (at) simplywallst.com.
This article by Simply Wall St is general in nature. We provide commentary based on historical data and analyst forecasts only using an unbiased methodology and our articles are not intended to be financial advice. It does not constitute a recommendation to buy or sell any stock, and does not take account of your objectives, or your financial situation. We aim to bring you long-term focused analysis driven by fundamental data. Note that our analysis may not factor in the latest price-sensitive company announcements or qualitative material. Simply Wall St has no position in any stocks mentioned.
