
 Yahoo Finance
 Returns On Capital Are Showing Encouraging Signs At Barrick Gold (TSE:ABX)
Did you know there are some financial metrics that can provide clues of a potential multi-bagger? One common approach is to try and find a company with returns on capital employed (ROCE) that are increasing, in conjunction with a growing amount of capital employed. Basically this means that a company has profitable initiatives that it can continue to reinvest in, which is a trait of a compounding machine. Speaking of which, we noticed some great changes in Barrick Gold's (TSE:ABX) returns on capital, so let's have a look.
What Is Return On Capital Employed (ROCE)?
For those that aren't sure what ROCE is, it measures the amount of pre-tax profits a company can generate from the capital employed in its business. To calculate this metric for Barrick Gold, this is the formula:
Return on Capital Employed = Earnings Before Interest and Tax (EBIT) ÷ (Total Assets - Current Liabilities)
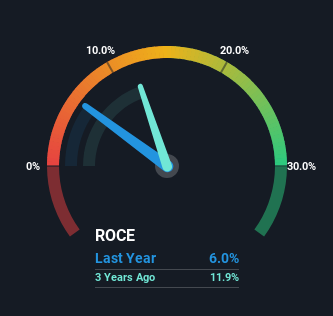
0.06 = US$2.6b ÷ (US$46b - US$2.2b) (Based on the trailing twelve months to March 2024).
Thus, Barrick Gold has an ROCE of 6.0%. In absolute terms, that's a low return, but it's much better than the Metals and Mining industry average of 2.3%.
Check out our latest analysis for Barrick Gold
In the above chart we have measured Barrick Gold's prior ROCE against its prior performance, but the future is arguably more important. If you'd like, you can check out the forecasts from the analysts covering Barrick Gold for free.
How Are Returns Trending?
We're glad to see that ROCE is heading in the right direction, even if it is still low at the moment. The numbers show that in the last five years, the returns generated on capital employed have grown considerably to 6.0%. The company is effectively making more money per dollar of capital used, and it's worth noting that the amount of capital has increased too, by 42%. So we're very much inspired by what we're seeing at Barrick Gold thanks to its ability to profitably reinvest capital.
The Key Takeaway
To sum it up, Barrick Gold has proven it can reinvest in the business and generate higher returns on that capital employed, which is terrific. Since the stock has returned a solid 69% to shareholders over the last five years, it's fair to say investors are beginning to recognize these changes. So given the stock has proven it has promising trends, it's worth researching the company further to see if these trends are likely to persist.
If you want to continue researching Barrick Gold, you might be interested to know about the 1 warning sign that our analysis has discovered.
While Barrick Gold may not currently earn the highest returns, we've compiled a list of companies that currently earn more than 25% return on equity. Check out this free list here.
Have feedback on this article? Concerned about the content? Get in touch with us directly. Alternatively, email editorial-team (at) simplywallst.com.
This article by Simply Wall St is general in nature. We provide commentary based on historical data and analyst forecasts only using an unbiased methodology and our articles are not intended to be financial advice. It does not constitute a recommendation to buy or sell any stock, and does not take account of your objectives, or your financial situation. We aim to bring you long-term focused analysis driven by fundamental data. Note that our analysis may not factor in the latest price-sensitive company announcements or qualitative material. Simply Wall St has no position in any stocks mentioned.
