
 Yahoo Finance
 Returns On Capital Are Showing Encouraging Signs At Almadex Minerals (CVE:DEX)
If we want to find a stock that could multiply over the long term, what are the underlying trends we should look for? Typically, we'll want to notice a trend of growing return on capital employed (ROCE) and alongside that, an expanding base of capital employed. Ultimately, this demonstrates that it's a business that is reinvesting profits at increasing rates of return. So when we looked at Almadex Minerals (CVE:DEX) and its trend of ROCE, we really liked what we saw.
What Is Return On Capital Employed (ROCE)?
If you haven't worked with ROCE before, it measures the 'return' (pre-tax profit) a company generates from capital employed in its business. To calculate this metric for Almadex Minerals, this is the formula:
Return on Capital Employed = Earnings Before Interest and Tax (EBIT) ÷ (Total Assets - Current Liabilities)
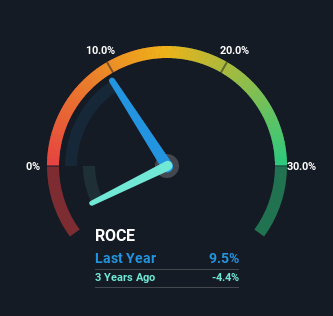
0.095 = CA$2.6m ÷ (CA$29m - CA$899k) (Based on the trailing twelve months to September 2022).
Therefore, Almadex Minerals has an ROCE of 9.5%. On its own that's a low return, but compared to the average of 1.2% generated by the Metals and Mining industry, it's much better.
See our latest analysis for Almadex Minerals
While the past is not representative of the future, it can be helpful to know how a company has performed historically, which is why we have this chart above. If you want to delve into the historical earnings, revenue and cash flow of Almadex Minerals, check out these free graphs here.
What Does the ROCE Trend For Almadex Minerals Tell Us?
We're delighted to see that Almadex Minerals is reaping rewards from its investments and is now generating some pre-tax profits. Shareholders would no doubt be pleased with this because the business was loss-making five years ago but is is now generating 9.5% on its capital. And unsurprisingly, like most companies trying to break into the black, Almadex Minerals is utilizing 85% more capital than it was five years ago. This can indicate that there's plenty of opportunities to invest capital internally and at ever higher rates, both common traits of a multi-bagger.
Our Take On Almadex Minerals' ROCE
To the delight of most shareholders, Almadex Minerals has now broken into profitability. Since the stock has returned a solid 37% to shareholders over the last three years, it's fair to say investors are beginning to recognize these changes. Therefore, we think it would be worth your time to check if these trends are going to continue.
Since virtually every company faces some risks, it's worth knowing what they are, and we've spotted 4 warning signs for Almadex Minerals (of which 1 is significant!) that you should know about.
While Almadex Minerals may not currently earn the highest returns, we've compiled a list of companies that currently earn more than 25% return on equity. Check out this free list here.
Have feedback on this article? Concerned about the content? Get in touch with us directly. Alternatively, email editorial-team (at) simplywallst.com.
This article by Simply Wall St is general in nature. We provide commentary based on historical data and analyst forecasts only using an unbiased methodology and our articles are not intended to be financial advice. It does not constitute a recommendation to buy or sell any stock, and does not take account of your objectives, or your financial situation. We aim to bring you long-term focused analysis driven by fundamental data. Note that our analysis may not factor in the latest price-sensitive company announcements or qualitative material. Simply Wall St has no position in any stocks mentioned.
Join A Paid User Research Session
You’ll receive a US$30 Amazon Gift card for 1 hour of your time while helping us build better investing tools for the individual investors like yourself. Sign up here
