
 Yahoo Finance
 Returns On Capital At Sanderson Design Group (LON:SDG) Have Hit The Brakes
If you're not sure where to start when looking for the next multi-bagger, there are a few key trends you should keep an eye out for. Firstly, we'd want to identify a growing return on capital employed (ROCE) and then alongside that, an ever-increasing base of capital employed. If you see this, it typically means it's a company with a great business model and plenty of profitable reinvestment opportunities. So, when we ran our eye over Sanderson Design Group's (LON:SDG) trend of ROCE, we liked what we saw.
Understanding Return On Capital Employed (ROCE)
For those who don't know, ROCE is a measure of a company's yearly pre-tax profit (its return), relative to the capital employed in the business. Analysts use this formula to calculate it for Sanderson Design Group:
Return on Capital Employed = Earnings Before Interest and Tax (EBIT) ÷ (Total Assets - Current Liabilities)
0.12 = UK£11m ÷ (UK£109m - UK£18m) (Based on the trailing twelve months to July 2023).
Therefore, Sanderson Design Group has an ROCE of 12%. On its own, that's a standard return, however it's much better than the 9.2% generated by the Consumer Durables industry.
View our latest analysis for Sanderson Design Group
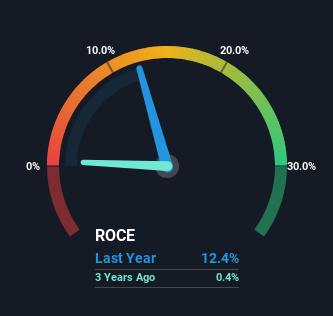
Above you can see how the current ROCE for Sanderson Design Group compares to its prior returns on capital, but there's only so much you can tell from the past. If you'd like to see what analysts are forecasting going forward, you should check out our free analyst report for Sanderson Design Group .
What Can We Tell From Sanderson Design Group's ROCE Trend?
While the current returns on capital are decent, they haven't changed much. Over the past five years, ROCE has remained relatively flat at around 12% and the business has deployed 24% more capital into its operations. Since 12% is a moderate ROCE though, it's good to see a business can continue to reinvest at these decent rates of return. Over long periods of time, returns like these might not be too exciting, but with consistency they can pay off in terms of share price returns.
The Key Takeaway
The main thing to remember is that Sanderson Design Group has proven its ability to continually reinvest at respectable rates of return. And the stock has done incredibly well with a 101% return over the last five years, so long term investors are no doubt ecstatic with that result. So even though the stock might be more "expensive" than it was before, we think the strong fundamentals warrant this stock for further research.
One more thing: We've identified 3 warning signs with Sanderson Design Group (at least 1 which is a bit concerning) , and understanding them would certainly be useful.
While Sanderson Design Group may not currently earn the highest returns, we've compiled a list of companies that currently earn more than 25% return on equity. Check out this free list here.
Have feedback on this article? Concerned about the content? Get in touch with us directly. Alternatively, email editorial-team (at) simplywallst.com.
This article by Simply Wall St is general in nature. We provide commentary based on historical data and analyst forecasts only using an unbiased methodology and our articles are not intended to be financial advice. It does not constitute a recommendation to buy or sell any stock, and does not take account of your objectives, or your financial situation. We aim to bring you long-term focused analysis driven by fundamental data. Note that our analysis may not factor in the latest price-sensitive company announcements or qualitative material. Simply Wall St has no position in any stocks mentioned.
