
 Yahoo Finance
 Returns on Capital Paint A Bright Future For CVR Energy (NYSE:CVI)
If you're not sure where to start when looking for the next multi-bagger, there are a few key trends you should keep an eye out for. Ideally, a business will show two trends; firstly a growing return on capital employed (ROCE) and secondly, an increasing amount of capital employed. Ultimately, this demonstrates that it's a business that is reinvesting profits at increasing rates of return. With that in mind, the ROCE of CVR Energy (NYSE:CVI) looks great, so lets see what the trend can tell us.
What Is Return On Capital Employed (ROCE)?
For those who don't know, ROCE is a measure of a company's yearly pre-tax profit (its return), relative to the capital employed in the business. Analysts use this formula to calculate it for CVR Energy:
Return on Capital Employed = Earnings Before Interest and Tax (EBIT) ÷ (Total Assets - Current Liabilities)
0.30 = US$919m ÷ (US$4.1b - US$1.0b) (Based on the trailing twelve months to March 2024).
Therefore, CVR Energy has an ROCE of 30%. In absolute terms that's a great return and it's even better than the Oil and Gas industry average of 12%.
Check out our latest analysis for CVR Energy
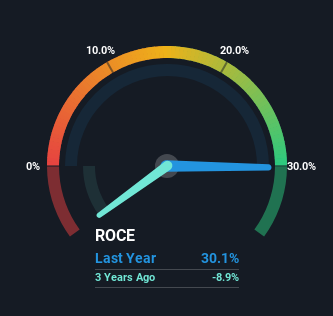
Above you can see how the current ROCE for CVR Energy compares to its prior returns on capital, but there's only so much you can tell from the past. If you're interested, you can view the analysts predictions in our free analyst report for CVR Energy .
So How Is CVR Energy's ROCE Trending?
CVR Energy's ROCE growth is quite impressive. More specifically, while the company has kept capital employed relatively flat over the last five years, the ROCE has climbed 76% in that same time. Basically the business is generating higher returns from the same amount of capital and that is proof that there are improvements in the company's efficiencies. On that front, things are looking good so it's worth exploring what management has said about growth plans going forward.
On a side note, we noticed that the improvement in ROCE appears to be partly fueled by an increase in current liabilities. Essentially the business now has suppliers or short-term creditors funding about 25% of its operations, which isn't ideal. Keep an eye out for future increases because when the ratio of current liabilities to total assets gets particularly high, this can introduce some new risks for the business.
In Conclusion...
As discussed above, CVR Energy appears to be getting more proficient at generating returns since capital employed has remained flat but earnings (before interest and tax) are up. Astute investors may have an opportunity here because the stock has declined 15% in the last five years. So researching this company further and determining whether or not these trends will continue seems justified.
CVR Energy does have some risks, we noticed 3 warning signs (and 1 which is a bit unpleasant) we think you should know about.
CVR Energy is not the only stock earning high returns. If you'd like to see more, check out our free list of companies earning high returns on equity with solid fundamentals.
Have feedback on this article? Concerned about the content? Get in touch with us directly. Alternatively, email editorial-team (at) simplywallst.com.
This article by Simply Wall St is general in nature. We provide commentary based on historical data and analyst forecasts only using an unbiased methodology and our articles are not intended to be financial advice. It does not constitute a recommendation to buy or sell any stock, and does not take account of your objectives, or your financial situation. We aim to bring you long-term focused analysis driven by fundamental data. Note that our analysis may not factor in the latest price-sensitive company announcements or qualitative material. Simply Wall St has no position in any stocks mentioned.
Have feedback on this article? Concerned about the content? Get in touch with us directly. Alternatively, email editorial-team@simplywallst.com
