
 Yahoo Finance
 Returns On Capital At Morgan Sindall Group (LON:MGNS) Have Stalled
To find a multi-bagger stock, what are the underlying trends we should look for in a business? Typically, we'll want to notice a trend of growing return on capital employed (ROCE) and alongside that, an expanding base of capital employed. Ultimately, this demonstrates that it's a business that is reinvesting profits at increasing rates of return. With that in mind, the ROCE of Morgan Sindall Group (LON:MGNS) looks decent, right now, so lets see what the trend of returns can tell us.
Return On Capital Employed (ROCE): What Is It?
Just to clarify if you're unsure, ROCE is a metric for evaluating how much pre-tax income (in percentage terms) a company earns on the capital invested in its business. The formula for this calculation on Morgan Sindall Group is:
Return on Capital Employed = Earnings Before Interest and Tax (EBIT) ÷ (Total Assets - Current Liabilities)
0.19 = UK£124m ÷ (UK£2.0b - UK£1.4b) (Based on the trailing twelve months to December 2023).
Therefore, Morgan Sindall Group has an ROCE of 19%. In absolute terms, that's a satisfactory return, but compared to the Construction industry average of 12% it's much better.
View our latest analysis for Morgan Sindall Group
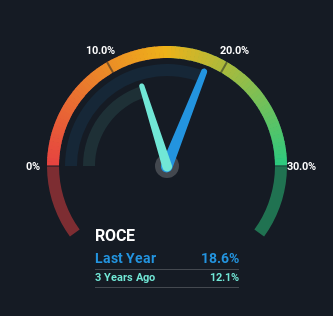
Above you can see how the current ROCE for Morgan Sindall Group compares to its prior returns on capital, but there's only so much you can tell from the past. If you're interested, you can view the analysts predictions in our free analyst report for Morgan Sindall Group .
What The Trend Of ROCE Can Tell Us
The trend of ROCE doesn't stand out much, but returns on a whole are decent. The company has consistently earned 19% for the last five years, and the capital employed within the business has risen 54% in that time. 19% is a pretty standard return, and it provides some comfort knowing that Morgan Sindall Group has consistently earned this amount. Over long periods of time, returns like these might not be too exciting, but with consistency they can pay off in terms of share price returns.
On a side note, Morgan Sindall Group's current liabilities are still rather high at 67% of total assets. This can bring about some risks because the company is basically operating with a rather large reliance on its suppliers or other sorts of short-term creditors. While it's not necessarily a bad thing, it can be beneficial if this ratio is lower.
What We Can Learn From Morgan Sindall Group's ROCE
To sum it up, Morgan Sindall Group has simply been reinvesting capital steadily, at those decent rates of return. And the stock has done incredibly well with a 111% return over the last five years, so long term investors are no doubt ecstatic with that result. So while investors seem to be recognizing these promising trends, we still believe the stock deserves further research.
If you'd like to know about the risks facing Morgan Sindall Group, we've discovered 1 warning sign that you should be aware of.
While Morgan Sindall Group may not currently earn the highest returns, we've compiled a list of companies that currently earn more than 25% return on equity. Check out this free list here.
Have feedback on this article? Concerned about the content? Get in touch with us directly. Alternatively, email editorial-team (at) simplywallst.com.
This article by Simply Wall St is general in nature. We provide commentary based on historical data and analyst forecasts only using an unbiased methodology and our articles are not intended to be financial advice. It does not constitute a recommendation to buy or sell any stock, and does not take account of your objectives, or your financial situation. We aim to bring you long-term focused analysis driven by fundamental data. Note that our analysis may not factor in the latest price-sensitive company announcements or qualitative material. Simply Wall St has no position in any stocks mentioned.
