
 Yahoo Finance
 The Returns On Capital At MillerKnoll (NASDAQ:MLKN) Don't Inspire Confidence
What trends should we look for it we want to identify stocks that can multiply in value over the long term? Firstly, we'll want to see a proven return on capital employed (ROCE) that is increasing, and secondly, an expanding base of capital employed. Basically this means that a company has profitable initiatives that it can continue to reinvest in, which is a trait of a compounding machine. However, after briefly looking over the numbers, we don't think MillerKnoll (NASDAQ:MLKN) has the makings of a multi-bagger going forward, but let's have a look at why that may be.
What Is Return On Capital Employed (ROCE)?
If you haven't worked with ROCE before, it measures the 'return' (pre-tax profit) a company generates from capital employed in its business. Analysts use this formula to calculate it for MillerKnoll:
Return on Capital Employed = Earnings Before Interest and Tax (EBIT) ÷ (Total Assets - Current Liabilities)
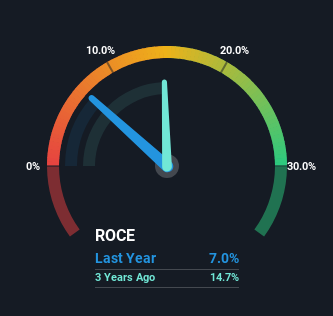
0.07 = US$239m ÷ (US$4.1b - US$681m) (Based on the trailing twelve months to March 2024).
Therefore, MillerKnoll has an ROCE of 7.0%. Ultimately, that's a low return and it under-performs the Commercial Services industry average of 10%.
View our latest analysis for MillerKnoll
In the above chart we have measured MillerKnoll's prior ROCE against its prior performance, but the future is arguably more important. If you're interested, you can view the analysts predictions in our free analyst report for MillerKnoll .
How Are Returns Trending?
When we looked at the ROCE trend at MillerKnoll, we didn't gain much confidence. To be more specific, ROCE has fallen from 17% over the last five years. Given the business is employing more capital while revenue has slipped, this is a bit concerning. This could mean that the business is losing its competitive advantage or market share, because while more money is being put into ventures, it's actually producing a lower return - "less bang for their buck" per se.
On a side note, MillerKnoll has done well to pay down its current liabilities to 17% of total assets. So we could link some of this to the decrease in ROCE. Effectively this means their suppliers or short-term creditors are funding less of the business, which reduces some elements of risk. Since the business is basically funding more of its operations with it's own money, you could argue this has made the business less efficient at generating ROCE.
The Bottom Line On MillerKnoll's ROCE
From the above analysis, we find it rather worrisome that returns on capital and sales for MillerKnoll have fallen, meanwhile the business is employing more capital than it was five years ago. It should come as no surprise then that the stock has fallen 17% over the last five years, so it looks like investors are recognizing these changes. Unless there is a shift to a more positive trajectory in these metrics, we would look elsewhere.
MillerKnoll does have some risks though, and we've spotted 3 warning signs for MillerKnoll that you might be interested in.
If you want to search for solid companies with great earnings, check out this free list of companies with good balance sheets and impressive returns on equity.
Have feedback on this article? Concerned about the content? Get in touch with us directly. Alternatively, email editorial-team (at) simplywallst.com.
This article by Simply Wall St is general in nature. We provide commentary based on historical data and analyst forecasts only using an unbiased methodology and our articles are not intended to be financial advice. It does not constitute a recommendation to buy or sell any stock, and does not take account of your objectives, or your financial situation. We aim to bring you long-term focused analysis driven by fundamental data. Note that our analysis may not factor in the latest price-sensitive company announcements or qualitative material. Simply Wall St has no position in any stocks mentioned.
