
 Yahoo Finance
 Returns On Capital At MAV Beauty Brands (TSE:MAV) Have Stalled
If we want to find a stock that could multiply over the long term, what are the underlying trends we should look for? Ideally, a business will show two trends; firstly a growing return on capital employed (ROCE) and secondly, an increasing amount of capital employed. Basically this means that a company has profitable initiatives that it can continue to reinvest in, which is a trait of a compounding machine. However, after briefly looking over the numbers, we don't think MAV Beauty Brands (TSE:MAV) has the makings of a multi-bagger going forward, but let's have a look at why that may be.
Understanding Return On Capital Employed (ROCE)
Just to clarify if you're unsure, ROCE is a metric for evaluating how much pre-tax income (in percentage terms) a company earns on the capital invested in its business. The formula for this calculation on MAV Beauty Brands is:
Return on Capital Employed = Earnings Before Interest and Tax (EBIT) ÷ (Total Assets - Current Liabilities)
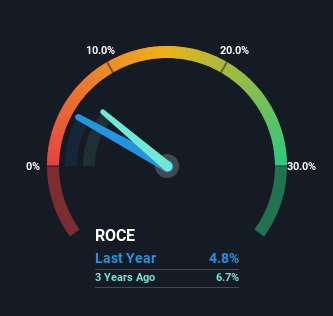
0.048 = US$4.7m ÷ (US$115m - US$17m) (Based on the trailing twelve months to June 2023).
Therefore, MAV Beauty Brands has an ROCE of 4.8%. Ultimately, that's a low return and it under-performs the Personal Products industry average of 13%.
View our latest analysis for MAV Beauty Brands
While the past is not representative of the future, it can be helpful to know how a company has performed historically, which is why we have this chart above. If you're interested in investigating MAV Beauty Brands' past further, check out this free graph of past earnings, revenue and cash flow.
How Are Returns Trending?
We're a bit concerned with the trends, because the business is applying 69% less capital than it was five years ago and returns on that capital have stayed flat. To us that doesn't look like a multi-bagger because the company appears to be selling assets and it's returns aren't increasing. In addition to that, since the ROCE doesn't scream "quality" at 4.8%, it's hard to get excited about these developments.
What We Can Learn From MAV Beauty Brands' ROCE
Overall, we're not ecstatic to see MAV Beauty Brands reducing the amount of capital it employs in the business. And investors may be expecting the fundamentals to get a lot worse because the stock has crashed 99% over the last five years. On the whole, we aren't too inspired by the underlying trends and we think there may be better chances of finding a multi-bagger elsewhere.
One final note, you should learn about the 4 warning signs we've spotted with MAV Beauty Brands (including 3 which make us uncomfortable) .
If you want to search for solid companies with great earnings, check out this free list of companies with good balance sheets and impressive returns on equity.
Have feedback on this article? Concerned about the content? Get in touch with us directly. Alternatively, email editorial-team (at) simplywallst.com.
This article by Simply Wall St is general in nature. We provide commentary based on historical data and analyst forecasts only using an unbiased methodology and our articles are not intended to be financial advice. It does not constitute a recommendation to buy or sell any stock, and does not take account of your objectives, or your financial situation. We aim to bring you long-term focused analysis driven by fundamental data. Note that our analysis may not factor in the latest price-sensitive company announcements or qualitative material. Simply Wall St has no position in any stocks mentioned.
