
 Yahoo Finance
 Returns On Capital - An Important Metric For KBR (NYSE:KBR)

What trends should we look for it we want to identify stocks that can multiply in value over the long term? One common approach is to try and find a company with returns on capital employed (ROCE) that are increasing, in conjunction with a growing amount of capital employed. Put simply, these types of businesses are compounding machines, meaning they are continually reinvesting their earnings at ever-higher rates of return. So when we looked at KBR (NYSE:KBR) and its trend of ROCE, we really liked what we saw.
Return On Capital Employed (ROCE): What is it?
If you haven't worked with ROCE before, it measures the 'return' (pre-tax profit) a company generates from capital employed in its business. To calculate this metric for KBR, this is the formula:
Return on Capital Employed = Earnings Before Interest and Tax (EBIT) ÷ (Total Assets - Current Liabilities)
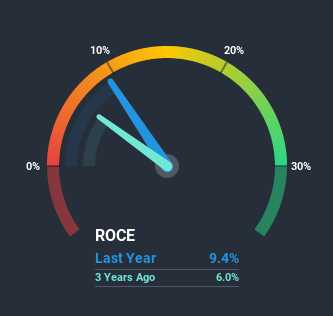
0.094 = US$326m ÷ (US$5.1b - US$1.6b) (Based on the trailing twelve months to March 2020).
So, KBR has an ROCE of 9.4%. On its own, that's a low figure but it's around the 9.8% average generated by the IT industry.
View our latest analysis for KBR
Above you can see how the current ROCE for KBR compares to its prior returns on capital, but there's only so much you can tell from the past. If you'd like to see what analysts are forecasting going forward, you should check out our free report for KBR.
What Does the ROCE Trend For KBR Tell Us?
We're delighted to see that KBR is reaping rewards from its investments and is now generating some pre-tax profits. Shareholders would no doubt be pleased with this because the business was loss-making five years ago but is is now generating 9.4% on its capital. Not only that, but the company is utilizing 68% more capital than before, but that's to be expected from a company trying to break into profitability. We like this trend, because it tells us the company has profitable reinvestment opportunities available to it, and if it continues going forward that can lead to a multi-bagger performance.
One more thing to note, KBR has decreased current liabilities to 32% of total assets over this period, which effectively reduces the amount of funding from suppliers or short-term creditors. So shareholders would be pleased that the growth in returns has mostly come from underlying business performance.
The Key Takeaway
To the delight of most shareholders, KBR has now broken into profitability. Since the stock has only returned 34% to shareholders over the last five years, the promising fundamentals may not be recognized yet by investors. So with that in mind, we think the stock deserves further research.
On a final note, we've found 3 warning signs for KBR that we think you should be aware of.
While KBR may not currently earn the highest returns, we've compiled a list of companies that currently earn more than 25% return on equity. Check out this free list here.
This article by Simply Wall St is general in nature. It does not constitute a recommendation to buy or sell any stock, and does not take account of your objectives, or your financial situation. We aim to bring you long-term focused analysis driven by fundamental data. Note that our analysis may not factor in the latest price-sensitive company announcements or qualitative material. Simply Wall St has no position in any stocks mentioned.
Have feedback on this article? Concerned about the content? Get in touch with us directly. Alternatively, email editorial-team@simplywallst.com.
