
 Yahoo Finance
 Returns On Capital At CSG Systems International (NASDAQ:CSGS) Have Stalled
Did you know there are some financial metrics that can provide clues of a potential multi-bagger? In a perfect world, we'd like to see a company investing more capital into its business and ideally the returns earned from that capital are also increasing. This shows us that it's a compounding machine, able to continually reinvest its earnings back into the business and generate higher returns. However, after briefly looking over the numbers, we don't think CSG Systems International (NASDAQ:CSGS) has the makings of a multi-bagger going forward, but let's have a look at why that may be.
Return On Capital Employed (ROCE): What Is It?
Just to clarify if you're unsure, ROCE is a metric for evaluating how much pre-tax income (in percentage terms) a company earns on the capital invested in its business. Analysts use this formula to calculate it for CSG Systems International:
Return on Capital Employed = Earnings Before Interest and Tax (EBIT) ÷ (Total Assets - Current Liabilities)
0.16 = US$141m ÷ (US$1.4b - US$561m) (Based on the trailing twelve months to December 2023).
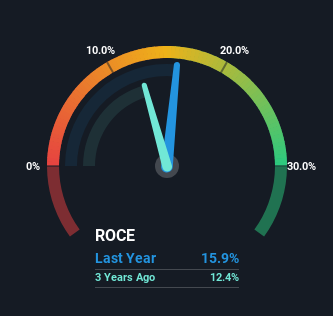
Thus, CSG Systems International has an ROCE of 16%. In absolute terms, that's a pretty normal return, and it's somewhat close to the Professional Services industry average of 13%.
Check out our latest analysis for CSG Systems International
In the above chart we have measured CSG Systems International's prior ROCE against its prior performance, but the future is arguably more important. If you'd like, you can check out the forecasts from the analysts covering CSG Systems International for free.
What Does the ROCE Trend For CSG Systems International Tell Us?
There hasn't been much to report for CSG Systems International's returns and its level of capital employed because both metrics have been steady for the past five years. It's not uncommon to see this when looking at a mature and stable business that isn't re-investing its earnings because it has likely passed that phase of the business cycle. So don't be surprised if CSG Systems International doesn't end up being a multi-bagger in a few years time.
Our Take On CSG Systems International's ROCE
In a nutshell, CSG Systems International has been trudging along with the same returns from the same amount of capital over the last five years. And investors may be recognizing these trends since the stock has only returned a total of 29% to shareholders over the last five years. So if you're looking for a multi-bagger, the underlying trends indicate you may have better chances elsewhere.
CSG Systems International does have some risks though, and we've spotted 1 warning sign for CSG Systems International that you might be interested in.
For those who like to invest in solid companies, check out this free list of companies with solid balance sheets and high returns on equity.
Have feedback on this article? Concerned about the content? Get in touch with us directly. Alternatively, email editorial-team (at) simplywallst.com.
This article by Simply Wall St is general in nature. We provide commentary based on historical data and analyst forecasts only using an unbiased methodology and our articles are not intended to be financial advice. It does not constitute a recommendation to buy or sell any stock, and does not take account of your objectives, or your financial situation. We aim to bring you long-term focused analysis driven by fundamental data. Note that our analysis may not factor in the latest price-sensitive company announcements or qualitative material. Simply Wall St has no position in any stocks mentioned.
