
 Yahoo Finance
 The Returns On Capital At Bumble (NASDAQ:BMBL) Don't Inspire Confidence
Did you know there are some financial metrics that can provide clues of a potential multi-bagger? One common approach is to try and find a company with returns on capital employed (ROCE) that are increasing, in conjunction with a growing amount of capital employed. If you see this, it typically means it's a company with a great business model and plenty of profitable reinvestment opportunities. In light of that, when we looked at Bumble (NASDAQ:BMBL) and its ROCE trend, we weren't exactly thrilled.
Understanding Return On Capital Employed (ROCE)
For those who don't know, ROCE is a measure of a company's yearly pre-tax profit (its return), relative to the capital employed in the business. Analysts use this formula to calculate it for Bumble:
Return on Capital Employed = Earnings Before Interest and Tax (EBIT) ÷ (Total Assets - Current Liabilities)
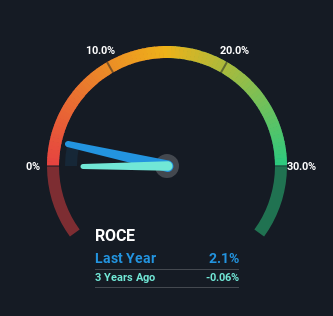
0.021 = US$69m ÷ (US$3.5b - US$201m) (Based on the trailing twelve months to March 2024).
Thus, Bumble has an ROCE of 2.1%. Ultimately, that's a low return and it under-performs the Interactive Media and Services industry average of 6.4%.
Check out our latest analysis for Bumble
Above you can see how the current ROCE for Bumble compares to its prior returns on capital, but there's only so much you can tell from the past. If you'd like to see what analysts are forecasting going forward, you should check out our free analyst report for Bumble .
So How Is Bumble's ROCE Trending?
When we looked at the ROCE trend at Bumble, we didn't gain much confidence. To be more specific, ROCE has fallen from 21% over the last five years. However, given capital employed and revenue have both increased it appears that the business is currently pursuing growth, at the consequence of short term returns. If these investments prove successful, this can bode very well for long term stock performance.
On a side note, Bumble has done well to pay down its current liabilities to 5.7% of total assets. Considering it used to be 63%, that's a huge drop in that ratio and it would explain the decline in ROCE. Effectively this means their suppliers or short-term creditors are funding less of the business, which reduces some elements of risk. Since the business is basically funding more of its operations with it's own money, you could argue this has made the business less efficient at generating ROCE.
What We Can Learn From Bumble's ROCE
In summary, despite lower returns in the short term, we're encouraged to see that Bumble is reinvesting for growth and has higher sales as a result. Despite these promising trends, the stock has collapsed 75% over the last three years, so there could be other factors hurting the company's prospects. Therefore, we'd suggest researching the stock further to uncover more about the business.
If you'd like to know about the risks facing Bumble, we've discovered 1 warning sign that you should be aware of.
While Bumble may not currently earn the highest returns, we've compiled a list of companies that currently earn more than 25% return on equity. Check out this free list here.
Have feedback on this article? Concerned about the content? Get in touch with us directly. Alternatively, email editorial-team (at) simplywallst.com.
This article by Simply Wall St is general in nature. We provide commentary based on historical data and analyst forecasts only using an unbiased methodology and our articles are not intended to be financial advice. It does not constitute a recommendation to buy or sell any stock, and does not take account of your objectives, or your financial situation. We aim to bring you long-term focused analysis driven by fundamental data. Note that our analysis may not factor in the latest price-sensitive company announcements or qualitative material. Simply Wall St has no position in any stocks mentioned.
