
 Yahoo Finance
 The Returns On Capital At Birchcliff Energy (TSE:BIR) Don't Inspire Confidence
What underlying fundamental trends can indicate that a company might be in decline? More often than not, we'll see a declining return on capital employed (ROCE) and a declining amount of capital employed. This indicates to us that the business is not only shrinking the size of its net assets, but its returns are falling as well. So after we looked into Birchcliff Energy (TSE:BIR), the trends above didn't look too great.
Return On Capital Employed (ROCE): What Is It?
Just to clarify if you're unsure, ROCE is a metric for evaluating how much pre-tax income (in percentage terms) a company earns on the capital invested in its business. Analysts use this formula to calculate it for Birchcliff Energy:
Return on Capital Employed = Earnings Before Interest and Tax (EBIT) ÷ (Total Assets - Current Liabilities)
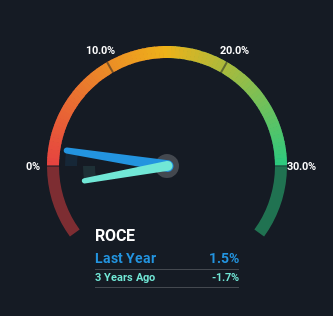
0.015 = CA$45m ÷ (CA$3.2b - CA$113m) (Based on the trailing twelve months to December 2023).
Therefore, Birchcliff Energy has an ROCE of 1.5%. In absolute terms, that's a low return and it also under-performs the Oil and Gas industry average of 9.0%.
View our latest analysis for Birchcliff Energy
In the above chart we have measured Birchcliff Energy's prior ROCE against its prior performance, but the future is arguably more important. If you're interested, you can view the analysts predictions in our free analyst report for Birchcliff Energy .
What Does the ROCE Trend For Birchcliff Energy Tell Us?
In terms of Birchcliff Energy's historical ROCE movements, the trend doesn't inspire confidence. To be more specific, the ROCE was 6.9% five years ago, but since then it has dropped noticeably. Meanwhile, capital employed in the business has stayed roughly the flat over the period. Companies that exhibit these attributes tend to not be shrinking, but they can be mature and facing pressure on their margins from competition. So because these trends aren't typically conducive to creating a multi-bagger, we wouldn't hold our breath on Birchcliff Energy becoming one if things continue as they have.
In Conclusion...
In the end, the trend of lower returns on the same amount of capital isn't typically an indication that we're looking at a growth stock. The market must be rosy on the stock's future because even though the underlying trends aren't too encouraging, the stock has soared 121%. Regardless, we don't feel too comfortable with the fundamentals so we'd be steering clear of this stock for now.
If you want to know some of the risks facing Birchcliff Energy we've found 2 warning signs (1 is significant!) that you should be aware of before investing here.
While Birchcliff Energy may not currently earn the highest returns, we've compiled a list of companies that currently earn more than 25% return on equity. Check out this free list here.
Have feedback on this article? Concerned about the content? Get in touch with us directly. Alternatively, email editorial-team (at) simplywallst.com.
This article by Simply Wall St is general in nature. We provide commentary based on historical data and analyst forecasts only using an unbiased methodology and our articles are not intended to be financial advice. It does not constitute a recommendation to buy or sell any stock, and does not take account of your objectives, or your financial situation. We aim to bring you long-term focused analysis driven by fundamental data. Note that our analysis may not factor in the latest price-sensitive company announcements or qualitative material. Simply Wall St has no position in any stocks mentioned.
