
 Yahoo Finance
 Returns On Capital At BIOREM (CVE:BRM) Paint A Concerning Picture
If you're not sure where to start when looking for the next multi-bagger, there are a few key trends you should keep an eye out for. Firstly, we'd want to identify a growing return on capital employed (ROCE) and then alongside that, an ever-increasing base of capital employed. This shows us that it's a compounding machine, able to continually reinvest its earnings back into the business and generate higher returns. However, after investigating BIOREM (CVE:BRM), we don't think it's current trends fit the mold of a multi-bagger.
Return On Capital Employed (ROCE): What is it?
Just to clarify if you're unsure, ROCE is a metric for evaluating how much pre-tax income (in percentage terms) a company earns on the capital invested in its business. To calculate this metric for BIOREM, this is the formula:
Return on Capital Employed = Earnings Before Interest and Tax (EBIT) ÷ (Total Assets - Current Liabilities)
0.078 = CA$1.1m ÷ (CA$23m - CA$8.4m) (Based on the trailing twelve months to September 2021).
So, BIOREM has an ROCE of 7.8%. Even though it's in line with the industry average of 7.8%, it's still a low return by itself.
Check out our latest analysis for BIOREM
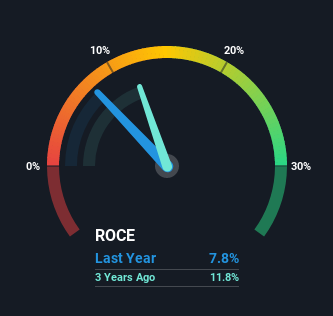
Historical performance is a great place to start when researching a stock so above you can see the gauge for BIOREM's ROCE against it's prior returns. If you're interested in investigating BIOREM's past further, check out this free graph of past earnings, revenue and cash flow.
So How Is BIOREM's ROCE Trending?
When we looked at the ROCE trend at BIOREM, we didn't gain much confidence. Around five years ago the returns on capital were 45%, but since then they've fallen to 7.8%. Meanwhile, the business is utilizing more capital but this hasn't moved the needle much in terms of sales in the past 12 months, so this could reflect longer term investments. It's worth keeping an eye on the company's earnings from here on to see if these investments do end up contributing to the bottom line.
On a side note, BIOREM has done well to pay down its current liabilities to 37% of total assets. So we could link some of this to the decrease in ROCE. Effectively this means their suppliers or short-term creditors are funding less of the business, which reduces some elements of risk. Since the business is basically funding more of its operations with it's own money, you could argue this has made the business less efficient at generating ROCE.
The Bottom Line On BIOREM's ROCE
To conclude, we've found that BIOREM is reinvesting in the business, but returns have been falling. Yet to long term shareholders the stock has gifted them an incredible 179% return in the last five years, so the market appears to be rosy about its future. Ultimately, if the underlying trends persist, we wouldn't hold our breath on it being a multi-bagger going forward.
On a final note, we found 3 warning signs for BIOREM (2 shouldn't be ignored) you should be aware of.
While BIOREM isn't earning the highest return, check out this free list of companies that are earning high returns on equity with solid balance sheets.
Have feedback on this article? Concerned about the content? Get in touch with us directly. Alternatively, email editorial-team (at) simplywallst.com.
This article by Simply Wall St is general in nature. We provide commentary based on historical data and analyst forecasts only using an unbiased methodology and our articles are not intended to be financial advice. It does not constitute a recommendation to buy or sell any stock, and does not take account of your objectives, or your financial situation. We aim to bring you long-term focused analysis driven by fundamental data. Note that our analysis may not factor in the latest price-sensitive company announcements or qualitative material. Simply Wall St has no position in any stocks mentioned.
