
 Yahoo Finance
 Returns On Capital At Aeries Technology (NASDAQ:AERT) Paint A Concerning Picture
Finding a business that has the potential to grow substantially is not easy, but it is possible if we look at a few key financial metrics. Ideally, a business will show two trends; firstly a growing return on capital employed (ROCE) and secondly, an increasing amount of capital employed. If you see this, it typically means it's a company with a great business model and plenty of profitable reinvestment opportunities. Although, when we looked at Aeries Technology (NASDAQ:AERT), it didn't seem to tick all of these boxes.
Understanding Return On Capital Employed (ROCE)
If you haven't worked with ROCE before, it measures the 'return' (pre-tax profit) a company generates from capital employed in its business. Analysts use this formula to calculate it for Aeries Technology:
Return on Capital Employed = Earnings Before Interest and Tax (EBIT) ÷ (Total Assets - Current Liabilities)
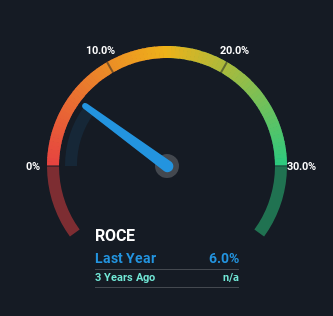
0.06 = US$1.5m ÷ (US$39m - US$14m) (Based on the trailing twelve months to June 2023).
Thus, Aeries Technology has an ROCE of 6.0%. In absolute terms, that's a low return and it also under-performs the Professional Services industry average of 12%.
Check out our latest analysis for Aeries Technology
While the past is not representative of the future, it can be helpful to know how a company has performed historically, which is why we have this chart above. If you want to delve into the historical earnings, revenue and cash flow of Aeries Technology, check out these free graphs here.
What Does the ROCE Trend For Aeries Technology Tell Us?
In terms of Aeries Technology's historical ROCE movements, the trend isn't fantastic. Around two years ago the returns on capital were 17%, but since then they've fallen to 6.0%. However, given capital employed and revenue have both increased it appears that the business is currently pursuing growth, at the consequence of short term returns. If these investments prove successful, this can bode very well for long term stock performance.
The Bottom Line On Aeries Technology's ROCE
In summary, despite lower returns in the short term, we're encouraged to see that Aeries Technology is reinvesting for growth and has higher sales as a result. Despite these promising trends, the stock has collapsed 83% over the last year, so there could be other factors hurting the company's prospects. Regardless, reinvestment can pay off in the long run, so we think astute investors may want to look further into this stock.
Since virtually every company faces some risks, it's worth knowing what they are, and we've spotted 3 warning signs for Aeries Technology (of which 1 is concerning!) that you should know about.
For those who like to invest in solid companies, check out this free list of companies with solid balance sheets and high returns on equity.
Have feedback on this article? Concerned about the content? Get in touch with us directly. Alternatively, email editorial-team (at) simplywallst.com.
This article by Simply Wall St is general in nature. We provide commentary based on historical data and analyst forecasts only using an unbiased methodology and our articles are not intended to be financial advice. It does not constitute a recommendation to buy or sell any stock, and does not take account of your objectives, or your financial situation. We aim to bring you long-term focused analysis driven by fundamental data. Note that our analysis may not factor in the latest price-sensitive company announcements or qualitative material. Simply Wall St has no position in any stocks mentioned.
