
 Yahoo Finance
 Returns At Byron Energy (ASX:BYE) Are On The Way Up
What trends should we look for it we want to identify stocks that can multiply in value over the long term? Firstly, we'd want to identify a growing return on capital employed (ROCE) and then alongside that, an ever-increasing base of capital employed. Basically this means that a company has profitable initiatives that it can continue to reinvest in, which is a trait of a compounding machine. So on that note, Byron Energy (ASX:BYE) looks quite promising in regards to its trends of return on capital.
Return On Capital Employed (ROCE): What Is It?
For those who don't know, ROCE is a measure of a company's yearly pre-tax profit (its return), relative to the capital employed in the business. Analysts use this formula to calculate it for Byron Energy:
Return on Capital Employed = Earnings Before Interest and Tax (EBIT) ÷ (Total Assets - Current Liabilities)
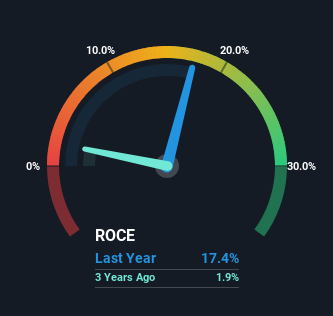
0.17 = US$24m ÷ (US$144m - US$6.5m) (Based on the trailing twelve months to June 2023).
Thus, Byron Energy has an ROCE of 17%. In absolute terms, that's a pretty normal return, and it's somewhat close to the Oil and Gas industry average of 16%.
See our latest analysis for Byron Energy
While the past is not representative of the future, it can be helpful to know how a company has performed historically, which is why we have this chart above. If you want to delve into the historical earnings, revenue and cash flow of Byron Energy, check out these free graphs here.
How Are Returns Trending?
The trends we've noticed at Byron Energy are quite reassuring. The numbers show that in the last five years, the returns generated on capital employed have grown considerably to 17%. The company is effectively making more money per dollar of capital used, and it's worth noting that the amount of capital has increased too, by 354%. The increasing returns on a growing amount of capital is common amongst multi-baggers and that's why we're impressed.
On a related note, the company's ratio of current liabilities to total assets has decreased to 4.5%, which basically reduces it's funding from the likes of short-term creditors or suppliers. This tells us that Byron Energy has grown its returns without a reliance on increasing their current liabilities, which we're very happy with.
The Bottom Line On Byron Energy's ROCE
In summary, it's great to see that Byron Energy can compound returns by consistently reinvesting capital at increasing rates of return, because these are some of the key ingredients of those highly sought after multi-baggers. Given the stock has declined 70% in the last five years, this could be a good investment if the valuation and other metrics are also appealing. So researching this company further and determining whether or not these trends will continue seems justified.
If you'd like to know about the risks facing Byron Energy, we've discovered 1 warning sign that you should be aware of.
While Byron Energy isn't earning the highest return, check out this free list of companies that are earning high returns on equity with solid balance sheets.
Have feedback on this article? Concerned about the content? Get in touch with us directly. Alternatively, email editorial-team (at) simplywallst.com.
This article by Simply Wall St is general in nature. We provide commentary based on historical data and analyst forecasts only using an unbiased methodology and our articles are not intended to be financial advice. It does not constitute a recommendation to buy or sell any stock, and does not take account of your objectives, or your financial situation. We aim to bring you long-term focused analysis driven by fundamental data. Note that our analysis may not factor in the latest price-sensitive company announcements or qualitative material. Simply Wall St has no position in any stocks mentioned.
