
 Yahoo Finance
 The Return Trends At UFP Industries (NASDAQ:UFPI) Look Promising
There are a few key trends to look for if we want to identify the next multi-bagger. Ideally, a business will show two trends; firstly a growing return on capital employed (ROCE) and secondly, an increasing amount of capital employed. This shows us that it's a compounding machine, able to continually reinvest its earnings back into the business and generate higher returns. So when we looked at UFP Industries (NASDAQ:UFPI) and its trend of ROCE, we really liked what we saw.
Understanding Return On Capital Employed (ROCE)
For those who don't know, ROCE is a measure of a company's yearly pre-tax profit (its return), relative to the capital employed in the business. The formula for this calculation on UFP Industries is:
Return on Capital Employed = Earnings Before Interest and Tax (EBIT) ÷ (Total Assets - Current Liabilities)
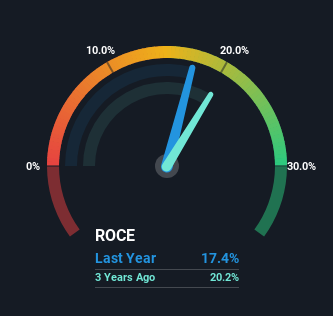
0.17 = US$619m ÷ (US$4.1b - US$525m) (Based on the trailing twelve months to March 2024).
So, UFP Industries has an ROCE of 17%. By itself that's a normal return on capital and it's in line with the industry's average returns of 17%.
View our latest analysis for UFP Industries
In the above chart we have measured UFP Industries' prior ROCE against its prior performance, but the future is arguably more important. If you're interested, you can view the analysts predictions in our free analyst report for UFP Industries .
How Are Returns Trending?
UFP Industries is displaying some positive trends. The data shows that returns on capital have increased substantially over the last five years to 17%. The company is effectively making more money per dollar of capital used, and it's worth noting that the amount of capital has increased too, by 137%. This can indicate that there's plenty of opportunities to invest capital internally and at ever higher rates, a combination that's common among multi-baggers.
Our Take On UFP Industries' ROCE
A company that is growing its returns on capital and can consistently reinvest in itself is a highly sought after trait, and that's what UFP Industries has. And a remarkable 216% total return over the last five years tells us that investors are expecting more good things to come in the future. Therefore, we think it would be worth your time to check if these trends are going to continue.
UFP Industries does have some risks though, and we've spotted 1 warning sign for UFP Industries that you might be interested in.
While UFP Industries may not currently earn the highest returns, we've compiled a list of companies that currently earn more than 25% return on equity. Check out this free list here.
Have feedback on this article? Concerned about the content? Get in touch with us directly. Alternatively, email editorial-team (at) simplywallst.com.
This article by Simply Wall St is general in nature. We provide commentary based on historical data and analyst forecasts only using an unbiased methodology and our articles are not intended to be financial advice. It does not constitute a recommendation to buy or sell any stock, and does not take account of your objectives, or your financial situation. We aim to bring you long-term focused analysis driven by fundamental data. Note that our analysis may not factor in the latest price-sensitive company announcements or qualitative material. Simply Wall St has no position in any stocks mentioned.
Have feedback on this article? Concerned about the content? Get in touch with us directly. Alternatively, email editorial-team@simplywallst.com
