
 Yahoo Finance
 Return Trends At Tree Island Steel (TSE:TSL) Aren't Appealing
To find a multi-bagger stock, what are the underlying trends we should look for in a business? Firstly, we'll want to see a proven return on capital employed (ROCE) that is increasing, and secondly, an expanding base of capital employed. If you see this, it typically means it's a company with a great business model and plenty of profitable reinvestment opportunities. With that in mind, the ROCE of Tree Island Steel (TSE:TSL) looks decent, right now, so lets see what the trend of returns can tell us.
Understanding Return On Capital Employed (ROCE)
Just to clarify if you're unsure, ROCE is a metric for evaluating how much pre-tax income (in percentage terms) a company earns on the capital invested in its business. To calculate this metric for Tree Island Steel, this is the formula:
Return on Capital Employed = Earnings Before Interest and Tax (EBIT) ÷ (Total Assets - Current Liabilities)
0.13 = CA$21m ÷ (CA$176m - CA$17m) (Based on the trailing twelve months to September 2023).
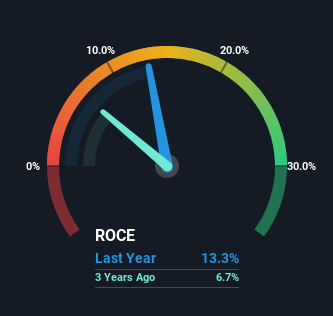
Therefore, Tree Island Steel has an ROCE of 13%. In absolute terms, that's a satisfactory return, but compared to the Metals and Mining industry average of 2.5% it's much better.
View our latest analysis for Tree Island Steel
While the past is not representative of the future, it can be helpful to know how a company has performed historically, which is why we have this chart above. If you want to delve into the historical earnings, revenue and cash flow of Tree Island Steel, check out these free graphs here.
What Can We Tell From Tree Island Steel's ROCE Trend?
While the returns on capital are good, they haven't moved much. The company has employed 89% more capital in the last five years, and the returns on that capital have remained stable at 13%. 13% is a pretty standard return, and it provides some comfort knowing that Tree Island Steel has consistently earned this amount. Stable returns in this ballpark can be unexciting, but if they can be maintained over the long run, they often provide nice rewards to shareholders.
One more thing to note, even though ROCE has remained relatively flat over the last five years, the reduction in current liabilities to 9.6% of total assets, is good to see from a business owner's perspective. Effectively suppliers now fund less of the business, which can lower some elements of risk.
The Bottom Line On Tree Island Steel's ROCE
To sum it up, Tree Island Steel has simply been reinvesting capital steadily, at those decent rates of return. And the stock has done incredibly well with a 139% return over the last five years, so long term investors are no doubt ecstatic with that result. So while investors seem to be recognizing these promising trends, we still believe the stock deserves further research.
Tree Island Steel does have some risks though, and we've spotted 4 warning signs for Tree Island Steel that you might be interested in.
For those who like to invest in solid companies, check out this free list of companies with solid balance sheets and high returns on equity.
Have feedback on this article? Concerned about the content? Get in touch with us directly. Alternatively, email editorial-team (at) simplywallst.com.
This article by Simply Wall St is general in nature. We provide commentary based on historical data and analyst forecasts only using an unbiased methodology and our articles are not intended to be financial advice. It does not constitute a recommendation to buy or sell any stock, and does not take account of your objectives, or your financial situation. We aim to bring you long-term focused analysis driven by fundamental data. Note that our analysis may not factor in the latest price-sensitive company announcements or qualitative material. Simply Wall St has no position in any stocks mentioned.
