
 Yahoo Finance
 Return Trends At Sutton Harbour Group (LON:SUH) Aren't Appealing
If we want to find a potential multi-bagger, often there are underlying trends that can provide clues. Ideally, a business will show two trends; firstly a growing return on capital employed (ROCE) and secondly, an increasing amount of capital employed. If you see this, it typically means it's a company with a great business model and plenty of profitable reinvestment opportunities. However, after briefly looking over the numbers, we don't think Sutton Harbour Group (LON:SUH) has the makings of a multi-bagger going forward, but let's have a look at why that may be.
Understanding Return On Capital Employed (ROCE)
Just to clarify if you're unsure, ROCE is a metric for evaluating how much pre-tax income (in percentage terms) a company earns on the capital invested in its business. To calculate this metric for Sutton Harbour Group, this is the formula:
Return on Capital Employed = Earnings Before Interest and Tax (EBIT) ÷ (Total Assets - Current Liabilities)
0.014 = UK£1.2m ÷ (UK£99m - UK£14m) (Based on the trailing twelve months to September 2023).
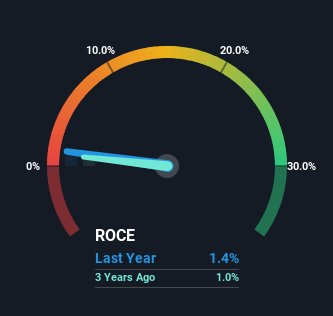
Therefore, Sutton Harbour Group has an ROCE of 1.4%. In absolute terms, that's a low return and it also under-performs the Infrastructure industry average of 9.8%.
See our latest analysis for Sutton Harbour Group
While the past is not representative of the future, it can be helpful to know how a company has performed historically, which is why we have this chart above. If you want to delve into the historical earnings, revenue and cash flow of Sutton Harbour Group, check out these free graphs here.
What Does the ROCE Trend For Sutton Harbour Group Tell Us?
There are better returns on capital out there than what we're seeing at Sutton Harbour Group. Over the past five years, ROCE has remained relatively flat at around 1.4% and the business has deployed 27% more capital into its operations. This poor ROCE doesn't inspire confidence right now, and with the increase in capital employed, it's evident that the business isn't deploying the funds into high return investments.
On another note, while the change in ROCE trend might not scream for attention, it's interesting that the current liabilities have actually gone up over the last five years. This is intriguing because if current liabilities hadn't increased to 14% of total assets, this reported ROCE would probably be less than1.4% because total capital employed would be higher.The 1.4% ROCE could be even lower if current liabilities weren't 14% of total assets, because the the formula would show a larger base of total capital employed. So while current liabilities isn't high right now, keep an eye out in case it increases further, because this can introduce some elements of risk.
In Conclusion...
In summary, Sutton Harbour Group has simply been reinvesting capital and generating the same low rate of return as before. And investors appear hesitant that the trends will pick up because the stock has fallen 46% in the last five years. Therefore based on the analysis done in this article, we don't think Sutton Harbour Group has the makings of a multi-bagger.
Sutton Harbour Group does have some risks, we noticed 4 warning signs (and 2 which shouldn't be ignored) we think you should know about.
While Sutton Harbour Group may not currently earn the highest returns, we've compiled a list of companies that currently earn more than 25% return on equity. Check out this free list here.
Have feedback on this article? Concerned about the content? Get in touch with us directly. Alternatively, email editorial-team (at) simplywallst.com.
This article by Simply Wall St is general in nature. We provide commentary based on historical data and analyst forecasts only using an unbiased methodology and our articles are not intended to be financial advice. It does not constitute a recommendation to buy or sell any stock, and does not take account of your objectives, or your financial situation. We aim to bring you long-term focused analysis driven by fundamental data. Note that our analysis may not factor in the latest price-sensitive company announcements or qualitative material. Simply Wall St has no position in any stocks mentioned.
