
 Yahoo Finance
 Return Trends At RELX (LON:REL) Aren't Appealing
If you're not sure where to start when looking for the next multi-bagger, there are a few key trends you should keep an eye out for. Firstly, we'll want to see a proven return on capital employed (ROCE) that is increasing, and secondly, an expanding base of capital employed. Basically this means that a company has profitable initiatives that it can continue to reinvest in, which is a trait of a compounding machine. So while RELX (LON:REL) has a high ROCE right now, lets see what we can decipher from how returns are changing.
Understanding Return On Capital Employed (ROCE)
Just to clarify if you're unsure, ROCE is a metric for evaluating how much pre-tax income (in percentage terms) a company earns on the capital invested in its business. Analysts use this formula to calculate it for RELX:
Return on Capital Employed = Earnings Before Interest and Tax (EBIT) ÷ (Total Assets - Current Liabilities)
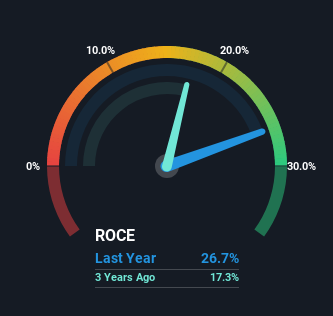
0.27 = UK£2.5b ÷ (UK£15b - UK£5.2b) (Based on the trailing twelve months to June 2023).
Thus, RELX has an ROCE of 27%. That's a fantastic return and not only that, it outpaces the average of 15% earned by companies in a similar industry.
See our latest analysis for RELX
In the above chart we have measured RELX's prior ROCE against its prior performance, but the future is arguably more important. If you'd like to see what analysts are forecasting going forward, you should check out our free report for RELX.
What Does the ROCE Trend For RELX Tell Us?
Over the past five years, RELX's ROCE and capital employed have both remained mostly flat. It's not uncommon to see this when looking at a mature and stable business that isn't re-investing its earnings because it has likely passed that phase of the business cycle. Although current returns are high, we'd need more evidence of underlying growth for it to look like a multi-bagger going forward. This probably explains why RELX is paying out 51% of its income to shareholders in the form of dividends. Given the business isn't reinvesting in itself, it makes sense to distribute a portion of earnings among shareholders.
Our Take On RELX's ROCE
While RELX has impressive profitability from its capital, it isn't increasing that amount of capital. Investors must think there's better things to come because the stock has knocked it out of the park, delivering a 113% gain to shareholders who have held over the last five years. Ultimately, if the underlying trends persist, we wouldn't hold our breath on it being a multi-bagger going forward.
One more thing, we've spotted 1 warning sign facing RELX that you might find interesting.
RELX is not the only stock earning high returns. If you'd like to see more, check out our free list of companies earning high returns on equity with solid fundamentals.
Have feedback on this article? Concerned about the content? Get in touch with us directly. Alternatively, email editorial-team (at) simplywallst.com.
This article by Simply Wall St is general in nature. We provide commentary based on historical data and analyst forecasts only using an unbiased methodology and our articles are not intended to be financial advice. It does not constitute a recommendation to buy or sell any stock, and does not take account of your objectives, or your financial situation. We aim to bring you long-term focused analysis driven by fundamental data. Note that our analysis may not factor in the latest price-sensitive company announcements or qualitative material. Simply Wall St has no position in any stocks mentioned.
