
 Yahoo Finance
 The Return Trends At Redcentric (LON:RCN) Look Promising
What are the early trends we should look for to identify a stock that could multiply in value over the long term? In a perfect world, we'd like to see a company investing more capital into its business and ideally the returns earned from that capital are also increasing. Put simply, these types of businesses are compounding machines, meaning they are continually reinvesting their earnings at ever-higher rates of return. So when we looked at Redcentric (LON:RCN) and its trend of ROCE, we really liked what we saw.
Return On Capital Employed (ROCE): What is it?
If you haven't worked with ROCE before, it measures the 'return' (pre-tax profit) a company generates from capital employed in its business. To calculate this metric for Redcentric, this is the formula:
Return on Capital Employed = Earnings Before Interest and Tax (EBIT) ÷ (Total Assets - Current Liabilities)
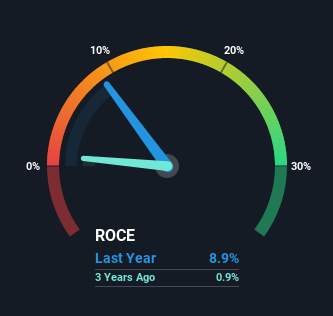
0.089 = UK£8.5m ÷ (UK£123m - UK£28m) (Based on the trailing twelve months to March 2021).
Thus, Redcentric has an ROCE of 8.9%. Ultimately, that's a low return and it under-performs the IT industry average of 13%.
View our latest analysis for Redcentric
Above you can see how the current ROCE for Redcentric compares to its prior returns on capital, but there's only so much you can tell from the past. If you'd like to see what analysts are forecasting going forward, you should check out our free report for Redcentric.
So How Is Redcentric's ROCE Trending?
We're delighted to see that Redcentric is reaping rewards from its investments and has now broken into profitability. While the business was unprofitable in the past, it's now turned things around and is earning 8.9% on its capital. On top of that, what's interesting is that the amount of capital being employed has remained steady, so the business hasn't needed to put any additional money to work to generate these higher returns. With no noticeable increase in capital employed, it's worth knowing what the company plans on doing going forward in regards to reinvesting and growing the business. Because in the end, a business can only get so efficient.
Our Take On Redcentric's ROCE
In summary, we're delighted to see that Redcentric has been able to increase efficiencies and earn higher rates of return on the same amount of capital. And since the stock has fallen 13% over the last five years, there might be an opportunity here. With that in mind, we believe the promising trends warrant this stock for further investigation.
If you'd like to know more about Redcentric, we've spotted 3 warning signs, and 1 of them makes us a bit uncomfortable.
While Redcentric isn't earning the highest return, check out this free list of companies that are earning high returns on equity with solid balance sheets.
This article by Simply Wall St is general in nature. We provide commentary based on historical data and analyst forecasts only using an unbiased methodology and our articles are not intended to be financial advice. It does not constitute a recommendation to buy or sell any stock, and does not take account of your objectives, or your financial situation. We aim to bring you long-term focused analysis driven by fundamental data. Note that our analysis may not factor in the latest price-sensitive company announcements or qualitative material. Simply Wall St has no position in any stocks mentioned.
Have feedback on this article? Concerned about the content? Get in touch with us directly. Alternatively, email editorial-team (at) simplywallst.com.
