
 Yahoo Finance
 The Return Trends At Kosmos Energy (NYSE:KOS) Look Promising
If we want to find a potential multi-bagger, often there are underlying trends that can provide clues. In a perfect world, we'd like to see a company investing more capital into its business and ideally the returns earned from that capital are also increasing. Basically this means that a company has profitable initiatives that it can continue to reinvest in, which is a trait of a compounding machine. Speaking of which, we noticed some great changes in Kosmos Energy's (NYSE:KOS) returns on capital, so let's have a look.
What Is Return On Capital Employed (ROCE)?
For those who don't know, ROCE is a measure of a company's yearly pre-tax profit (its return), relative to the capital employed in the business. Analysts use this formula to calculate it for Kosmos Energy:
Return on Capital Employed = Earnings Before Interest and Tax (EBIT) ÷ (Total Assets - Current Liabilities)
0.11 = US$468m ÷ (US$4.9b - US$555m) (Based on the trailing twelve months to December 2023).
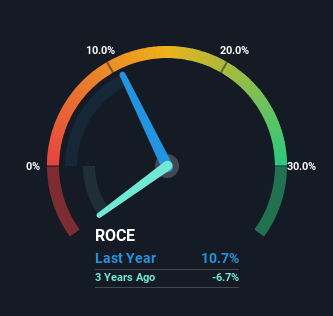
Therefore, Kosmos Energy has an ROCE of 11%. In isolation, that's a pretty standard return but against the Oil and Gas industry average of 15%, it's not as good.
See our latest analysis for Kosmos Energy
Above you can see how the current ROCE for Kosmos Energy compares to its prior returns on capital, but there's only so much you can tell from the past. If you'd like, you can check out the forecasts from the analysts covering Kosmos Energy for free.
What Does the ROCE Trend For Kosmos Energy Tell Us?
Kosmos Energy has broken into the black (profitability) and we're sure it's a sight for sore eyes. While the business was unprofitable in the past, it's now turned things around and is earning 11% on its capital. While returns have increased, the amount of capital employed by Kosmos Energy has remained flat over the period. With no noticeable increase in capital employed, it's worth knowing what the company plans on doing going forward in regards to reinvesting and growing the business. So if you're looking for high growth, you'll want to see a business's capital employed also increasing.
The Key Takeaway
In summary, we're delighted to see that Kosmos Energy has been able to increase efficiencies and earn higher rates of return on the same amount of capital. And given the stock has remained rather flat over the last five years, there might be an opportunity here if other metrics are strong. That being the case, research into the company's current valuation metrics and future prospects seems fitting.
Like most companies, Kosmos Energy does come with some risks, and we've found 3 warning signs that you should be aware of.
While Kosmos Energy isn't earning the highest return, check out this free list of companies that are earning high returns on equity with solid balance sheets.
Have feedback on this article? Concerned about the content? Get in touch with us directly. Alternatively, email editorial-team (at) simplywallst.com.
This article by Simply Wall St is general in nature. We provide commentary based on historical data and analyst forecasts only using an unbiased methodology and our articles are not intended to be financial advice. It does not constitute a recommendation to buy or sell any stock, and does not take account of your objectives, or your financial situation. We aim to bring you long-term focused analysis driven by fundamental data. Note that our analysis may not factor in the latest price-sensitive company announcements or qualitative material. Simply Wall St has no position in any stocks mentioned.
