
 Yahoo Finance
 The Return Trends At IES Holdings (NASDAQ:IESC) Look Promising
If you're not sure where to start when looking for the next multi-bagger, there are a few key trends you should keep an eye out for. Firstly, we'll want to see a proven return on capital employed (ROCE) that is increasing, and secondly, an expanding base of capital employed. Basically this means that a company has profitable initiatives that it can continue to reinvest in, which is a trait of a compounding machine. So when we looked at IES Holdings (NASDAQ:IESC) and its trend of ROCE, we really liked what we saw.
What is Return On Capital Employed (ROCE)?
Just to clarify if you're unsure, ROCE is a metric for evaluating how much pre-tax income (in percentage terms) a company earns on the capital invested in its business. The formula for this calculation on IES Holdings is:
Return on Capital Employed = Earnings Before Interest and Tax (EBIT) ÷ (Total Assets - Current Liabilities)
0.14 = US$68m ÷ (US$831m - US$347m) (Based on the trailing twelve months to March 2022).
Thus, IES Holdings has an ROCE of 14%. On its own, that's a standard return, however it's much better than the 7.5% generated by the Construction industry.
View our latest analysis for IES Holdings
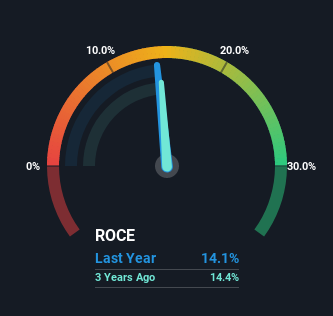
Historical performance is a great place to start when researching a stock so above you can see the gauge for IES Holdings' ROCE against it's prior returns. If you want to delve into the historical earnings, revenue and cash flow of IES Holdings, check out these free graphs here.
What Can We Tell From IES Holdings' ROCE Trend?
We like the trends that we're seeing from IES Holdings. The data shows that returns on capital have increased substantially over the last five years to 14%. The amount of capital employed has increased too, by 81%. This can indicate that there's plenty of opportunities to invest capital internally and at ever higher rates, a combination that's common among multi-baggers.
On a separate but related note, it's important to know that IES Holdings has a current liabilities to total assets ratio of 42%, which we'd consider pretty high. This can bring about some risks because the company is basically operating with a rather large reliance on its suppliers or other sorts of short-term creditors. While it's not necessarily a bad thing, it can be beneficial if this ratio is lower.
The Bottom Line
All in all, it's terrific to see that IES Holdings is reaping the rewards from prior investments and is growing its capital base. And investors seem to expect more of this going forward, since the stock has rewarded shareholders with a 67% return over the last five years. Therefore, we think it would be worth your time to check if these trends are going to continue.
IES Holdings does have some risks, we noticed 2 warning signs (and 1 which makes us a bit uncomfortable) we think you should know about.
While IES Holdings isn't earning the highest return, check out this free list of companies that are earning high returns on equity with solid balance sheets.
Have feedback on this article? Concerned about the content? Get in touch with us directly. Alternatively, email editorial-team (at) simplywallst.com.
This article by Simply Wall St is general in nature. We provide commentary based on historical data and analyst forecasts only using an unbiased methodology and our articles are not intended to be financial advice. It does not constitute a recommendation to buy or sell any stock, and does not take account of your objectives, or your financial situation. We aim to bring you long-term focused analysis driven by fundamental data. Note that our analysis may not factor in the latest price-sensitive company announcements or qualitative material. Simply Wall St has no position in any stocks mentioned.
Join A Paid User Research Session
You’ll receive a US$30 Amazon Gift card for 1 hour of your time while helping us build better investing tools for the individual investors like yourself. Sign up here
