
 Yahoo Finance
 The Return Trends At Foraco International (TSE:FAR) Look Promising
What are the early trends we should look for to identify a stock that could multiply in value over the long term? One common approach is to try and find a company with returns on capital employed (ROCE) that are increasing, in conjunction with a growing amount of capital employed. This shows us that it's a compounding machine, able to continually reinvest its earnings back into the business and generate higher returns. So on that note, Foraco International (TSE:FAR) looks quite promising in regards to its trends of return on capital.
What is Return On Capital Employed (ROCE)?
For those that aren't sure what ROCE is, it measures the amount of pre-tax profits a company can generate from the capital employed in its business. To calculate this metric for Foraco International, this is the formula:
Return on Capital Employed = Earnings Before Interest and Tax (EBIT) ÷ (Total Assets - Current Liabilities)
0.16 = US$27m ÷ (US$250m - US$79m) (Based on the trailing twelve months to March 2022).
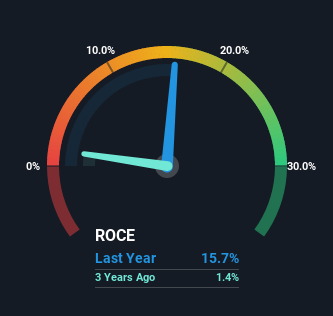
So, Foraco International has an ROCE of 16%. On its own, that's a standard return, however it's much better than the 1.9% generated by the Metals and Mining industry.
See our latest analysis for Foraco International
In the above chart we have measured Foraco International's prior ROCE against its prior performance, but the future is arguably more important. If you're interested, you can view the analysts predictions in our free report on analyst forecasts for the company.
So How Is Foraco International's ROCE Trending?
The fact that Foraco International is now generating some pre-tax profits from its prior investments is very encouraging. Shareholders would no doubt be pleased with this because the business was loss-making five years ago but is is now generating 16% on its capital. And unsurprisingly, like most companies trying to break into the black, Foraco International is utilizing 37% more capital than it was five years ago. This can indicate that there's plenty of opportunities to invest capital internally and at ever higher rates, both common traits of a multi-bagger.
In another part of our analysis, we noticed that the company's ratio of current liabilities to total assets decreased to 31%, which broadly means the business is relying less on its suppliers or short-term creditors to fund its operations. Therefore we can rest assured that the growth in ROCE is a result of the business' fundamental improvements, rather than a cooking class featuring this company's books.
The Key Takeaway
Overall, Foraco International gets a big tick from us thanks in most part to the fact that it is now profitable and is reinvesting in its business. Since the stock has returned a staggering 470% to shareholders over the last five years, it looks like investors are recognizing these changes. With that being said, we still think the promising fundamentals mean the company deserves some further due diligence.
Foraco International does come with some risks though, we found 3 warning signs in our investment analysis, and 2 of those don't sit too well with us...
While Foraco International may not currently earn the highest returns, we've compiled a list of companies that currently earn more than 25% return on equity. Check out this free list here.
Have feedback on this article? Concerned about the content? Get in touch with us directly. Alternatively, email editorial-team (at) simplywallst.com.
This article by Simply Wall St is general in nature. We provide commentary based on historical data and analyst forecasts only using an unbiased methodology and our articles are not intended to be financial advice. It does not constitute a recommendation to buy or sell any stock, and does not take account of your objectives, or your financial situation. We aim to bring you long-term focused analysis driven by fundamental data. Note that our analysis may not factor in the latest price-sensitive company announcements or qualitative material. Simply Wall St has no position in any stocks mentioned.
