
 Yahoo Finance
 Return Trends At Dine Brands Global (NYSE:DIN) Aren't Appealing
If you're looking for a multi-bagger, there's a few things to keep an eye out for. In a perfect world, we'd like to see a company investing more capital into its business and ideally the returns earned from that capital are also increasing. Put simply, these types of businesses are compounding machines, meaning they are continually reinvesting their earnings at ever-higher rates of return. However, after briefly looking over the numbers, we don't think Dine Brands Global (NYSE:DIN) has the makings of a multi-bagger going forward, but let's have a look at why that may be.
What Is Return On Capital Employed (ROCE)?
For those that aren't sure what ROCE is, it measures the amount of pre-tax profits a company can generate from the capital employed in its business. The formula for this calculation on Dine Brands Global is:
Return on Capital Employed = Earnings Before Interest and Tax (EBIT) ÷ (Total Assets - Current Liabilities)
0.13 = US$176m ÷ (US$1.9b - US$471m) (Based on the trailing twelve months to December 2022).
Thus, Dine Brands Global has an ROCE of 13%. On its own, that's a standard return, however it's much better than the 10% generated by the Hospitality industry.
Check out our latest analysis for Dine Brands Global
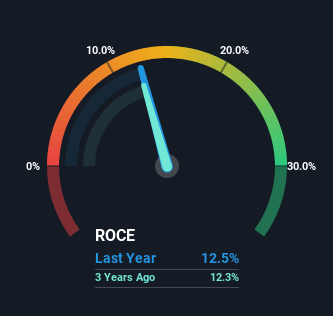
Above you can see how the current ROCE for Dine Brands Global compares to its prior returns on capital, but there's only so much you can tell from the past. If you'd like, you can check out the forecasts from the analysts covering Dine Brands Global here for free.
How Are Returns Trending?
Things have been pretty stable at Dine Brands Global, with its capital employed and returns on that capital staying somewhat the same for the last five years. This tells us the company isn't reinvesting in itself, so it's plausible that it's past the growth phase. So unless we see a substantial change at Dine Brands Global in terms of ROCE and additional investments being made, we wouldn't hold our breath on it being a multi-bagger. With fewer investment opportunities, it makes sense that Dine Brands Global has been paying out a decent 31% of its earnings to shareholders. Unless businesses have highly compelling growth opportunities, they'll typically return some money to shareholders.
The Bottom Line
In summary, Dine Brands Global isn't compounding its earnings but is generating stable returns on the same amount of capital employed. And with the stock having returned a mere 6.6% in the last five years to shareholders, you could argue that they're aware of these lackluster trends. As a result, if you're hunting for a multi-bagger, we think you'd have more luck elsewhere.
On a final note, we found 2 warning signs for Dine Brands Global (1 is significant) you should be aware of.
While Dine Brands Global may not currently earn the highest returns, we've compiled a list of companies that currently earn more than 25% return on equity. Check out this free list here.
Have feedback on this article? Concerned about the content? Get in touch with us directly. Alternatively, email editorial-team (at) simplywallst.com.
This article by Simply Wall St is general in nature. We provide commentary based on historical data and analyst forecasts only using an unbiased methodology and our articles are not intended to be financial advice. It does not constitute a recommendation to buy or sell any stock, and does not take account of your objectives, or your financial situation. We aim to bring you long-term focused analysis driven by fundamental data. Note that our analysis may not factor in the latest price-sensitive company announcements or qualitative material. Simply Wall St has no position in any stocks mentioned.
Join A Paid User Research Session
You’ll receive a US$30 Amazon Gift card for 1 hour of your time while helping us build better investing tools for the individual investors like yourself. Sign up here
