
 Yahoo Finance
 The Return Trends At Corteva (NYSE:CTVA) Look Promising
There are a few key trends to look for if we want to identify the next multi-bagger. One common approach is to try and find a company with returns on capital employed (ROCE) that are increasing, in conjunction with a growing amount of capital employed. This shows us that it's a compounding machine, able to continually reinvest its earnings back into the business and generate higher returns. Speaking of which, we noticed some great changes in Corteva's (NYSE:CTVA) returns on capital, so let's have a look.
Return On Capital Employed (ROCE): What Is It?
For those that aren't sure what ROCE is, it measures the amount of pre-tax profits a company can generate from the capital employed in its business. Analysts use this formula to calculate it for Corteva:
Return on Capital Employed = Earnings Before Interest and Tax (EBIT) ÷ (Total Assets - Current Liabilities)
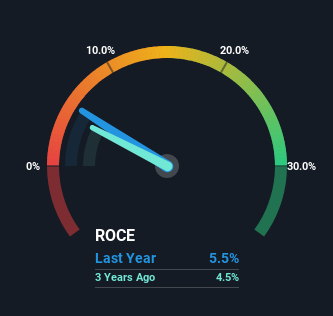
0.055 = US$1.8b ÷ (US$44b - US$11b) (Based on the trailing twelve months to March 2024).
Thus, Corteva has an ROCE of 5.5%. In absolute terms, that's a low return and it also under-performs the Chemicals industry average of 8.8%.
Check out our latest analysis for Corteva
In the above chart we have measured Corteva's prior ROCE against its prior performance, but the future is arguably more important. If you're interested, you can view the analysts predictions in our free analyst report for Corteva .
The Trend Of ROCE
Corteva has not disappointed in regards to ROCE growth. The figures show that over the last five years, returns on capital have grown by 404%. The company is now earning US$0.05 per dollar of capital employed. In regards to capital employed, Corteva appears to been achieving more with less, since the business is using 51% less capital to run its operation. If this trend continues, the business might be getting more efficient but it's shrinking in terms of total assets.
For the record though, there was a noticeable increase in the company's current liabilities over the period, so we would attribute some of the ROCE growth to that. The current liabilities has increased to 26% of total assets, so the business is now more funded by the likes of its suppliers or short-term creditors. Keep an eye out for future increases because when the ratio of current liabilities to total assets gets particularly high, this can introduce some new risks for the business.
Our Take On Corteva's ROCE
In summary, it's great to see that Corteva has been able to turn things around and earn higher returns on lower amounts of capital. Since the stock has returned a solid 30% to shareholders over the last three years, it's fair to say investors are beginning to recognize these changes. With that being said, we still think the promising fundamentals mean the company deserves some further due diligence.
Like most companies, Corteva does come with some risks, and we've found 2 warning signs that you should be aware of.
For those who like to invest in solid companies, check out this free list of companies with solid balance sheets and high returns on equity.
Have feedback on this article? Concerned about the content? Get in touch with us directly. Alternatively, email editorial-team (at) simplywallst.com.
This article by Simply Wall St is general in nature. We provide commentary based on historical data and analyst forecasts only using an unbiased methodology and our articles are not intended to be financial advice. It does not constitute a recommendation to buy or sell any stock, and does not take account of your objectives, or your financial situation. We aim to bring you long-term focused analysis driven by fundamental data. Note that our analysis may not factor in the latest price-sensitive company announcements or qualitative material. Simply Wall St has no position in any stocks mentioned.
