
 Yahoo Finance
 Return Trends At Bunzl (LON:BNZL) Aren't Appealing
If you're looking for a multi-bagger, there's a few things to keep an eye out for. Firstly, we'd want to identify a growing return on capital employed (ROCE) and then alongside that, an ever-increasing base of capital employed. Basically this means that a company has profitable initiatives that it can continue to reinvest in, which is a trait of a compounding machine. So, when we ran our eye over Bunzl's (LON:BNZL) trend of ROCE, we liked what we saw.
Return On Capital Employed (ROCE): What is it?
If you haven't worked with ROCE before, it measures the 'return' (pre-tax profit) a company generates from capital employed in its business. To calculate this metric for Bunzl, this is the formula:
Return on Capital Employed = Earnings Before Interest and Tax (EBIT) ÷ (Total Assets - Current Liabilities)
0.17 = UK£701m ÷ (UK£6.8b - UK£2.7b) (Based on the trailing twelve months to June 2021).
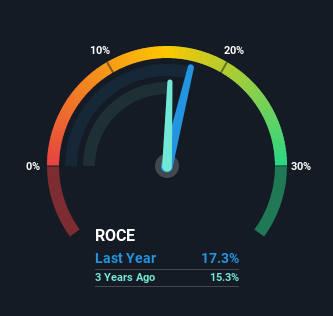
Thus, Bunzl has an ROCE of 17%. In absolute terms, that's a satisfactory return, but compared to the Trade Distributors industry average of 14% it's much better.
See our latest analysis for Bunzl
Above you can see how the current ROCE for Bunzl compares to its prior returns on capital, but there's only so much you can tell from the past. If you're interested, you can view the analysts predictions in our free report on analyst forecasts for the company.
What The Trend Of ROCE Can Tell Us
The trend of ROCE doesn't stand out much, but returns on a whole are decent. Over the past five years, ROCE has remained relatively flat at around 17% and the business has deployed 51% more capital into its operations. Since 17% is a moderate ROCE though, it's good to see a business can continue to reinvest at these decent rates of return. Over long periods of time, returns like these might not be too exciting, but with consistency they can pay off in terms of share price returns.
Another thing to note, Bunzl has a high ratio of current liabilities to total assets of 40%. This effectively means that suppliers (or short-term creditors) are funding a large portion of the business, so just be aware that this can introduce some elements of risk. While it's not necessarily a bad thing, it can be beneficial if this ratio is lower.
What We Can Learn From Bunzl's ROCE
The main thing to remember is that Bunzl has proven its ability to continually reinvest at respectable rates of return. And since the stock has risen strongly over the last five years, it appears the market might expect this trend to continue. So even though the stock might be more "expensive" than it was before, we think the strong fundamentals warrant this stock for further research.
Like most companies, Bunzl does come with some risks, and we've found 3 warning signs that you should be aware of.
While Bunzl may not currently earn the highest returns, we've compiled a list of companies that currently earn more than 25% return on equity. Check out this free list here.
Have feedback on this article? Concerned about the content? Get in touch with us directly. Alternatively, email editorial-team (at) simplywallst.com.
This article by Simply Wall St is general in nature. We provide commentary based on historical data and analyst forecasts only using an unbiased methodology and our articles are not intended to be financial advice. It does not constitute a recommendation to buy or sell any stock, and does not take account of your objectives, or your financial situation. We aim to bring you long-term focused analysis driven by fundamental data. Note that our analysis may not factor in the latest price-sensitive company announcements or qualitative material. Simply Wall St has no position in any stocks mentioned.
